Article Text

Abstract
The hospital performance measurement is critical for any institute to identify its areas of improvement and take appropriate corrective and preventive actions. However, to design a framework that is globally acceptable has always been a challenging task. The developed countries have formulated a few models but that cannot be implemented in the developing world without understanding their context. In this paper, we are sharing our process of sifting through the numerous frameworks and models to come up with an approach that works for Indus Hospital and Health Network. We also intend to highlight the leadership thought process and challenges in coming up with and implementing our approach. Our framework is based on including volume measures to the traditional value in healthcare measures of cost-effectiveness and quality. Moreover, our measurements were done at specialty or medical condition level in various types of services offered at our hospital. We have implemented this framework in our tertiary care hospital and deem that this model has given us the liberty to design key performance indicators according to specialties, services and medical conditions being dealt in our various facilities. We hope our experience will give healthcare leaders in similar settings ideas of how best to implement hospital performance indicators based on their own circumstances.
- performance management
- patient outcome
- productivity
- clinical leadership
- organisational effectiveness
Data availability statement
Data sharing not applicable as no datasets generated and/or analysed for this study.
This is an open access article distributed in accordance with the Creative Commons Attribution Non Commercial (CC BY-NC 4.0) license, which permits others to distribute, remix, adapt, build upon this work non-commercially, and license their derivative works on different terms, provided the original work is properly cited, appropriate credit is given, any changes made indicated, and the use is non-commercial. See: http://creativecommons.org/licenses/by-nc/4.0/.
Statistics from Altmetric.com
Introduction
Measuring hospital performance has been a difficult task with different frameworks being presented as early as the 1960s. The earliest published models of quantifying hospital productivity required complex calculations and were based on patient care and administrative measures.1 2 Later on, some models started focusing on financial ratios and linking financial feasibility with hospital performance,3–6 whereas others gauged hospital performance through decrease in mortality.7–9 Kaplan et al presented the Balanced Scorecard model that is considered one of the most influential contributions in performance measurements.10 Specifically, it gave the management performance information from four perspectives, that is, financial; customer; internal business and innovation; learning and growth.11 In 2003, with WHO’s report on how hospital performance can be measured and monitored,12 performance measures started to diversify with attention being given to quality care and clinical outcomes.13 A few years later, Porter’s value in healthcare gained significant popularity.14–17 This concept was based on outcomes that matter to patients and the cost incurred to deliver those outcomes. However, this did not undermine the need to have process indicators that are relatively easier to measure in a shorter time frame as compared with outcome measures.18 As a matter of fact, neither all processes nor all outcomes can be measured and the relationship of process measures with outcome measures and overall quality remains complex. To add to this complexity is the set of quality indicators defined by Agency for Healthcare Research and Quality19 and the Joint Commission International20 and the difficulty faced by hospitals with limited resources in measuring as well as linking these quality indicators to hospital performance in a viable and practical manner. Developing countries such as Pakistan and especially not-for-profit hospitals with finite resources such as ours have felt a vacuum in the models developed in and for a developed country.
Indus Hospital and Health Network’s path to measuring performance: background
Indus Hospital and Health Network is a network of hospitals providing medical services spanning primary to tertiary care throughout Pakistan. It is run entirely on donations and religious alms (zakat) with the promise of ensuring quality care for all. Thus, it is critically important for us to ensure we hold ourselves accountable on our service delivery cost-effectively and with optimal (not maximal) volumes. This paper is a reflection on the development and implementation of our hospital performance framework during my tenure as the medical director. The intention of this paper is to illustrate how each hospital needs to self-assess and adapt the international guidelines to suit one’s local context.
Indus’ journey to quantitatively measure hospital performance started in early 2017 when members of our senior management including myself were offered a course by Harvard Business School on ‘Strategy and Value Management for Global Health Care Delivery’. The course focused on measuring outcomes that matter to patient for any given service and the cost incurred to deliver that service, the latter being measured through Time-Driven Activity-Based Costing (TDABC). As the Medical Director, I decided to work towards incorporating a set of Patient-Reported Outcome Measures (PROMs). The faculty of all clinical specialties were engaged for more than 6 months along with the Quality Improvement and Patient Safety (QIPS) department to list down possible PROMs in each specialty. Around 356 clinical indicators were submitted for evaluation; but we found that a large majority of indicators were solely formulated from the physician’s perspective and may not be of importance from the patient perspective. For example, measuring HBA1c is a significant diabetes control indicator for the physician but it was not relatable or reportable by our patients who were more interested in focusing on their quality of life, or diabetic complications, etc. We concluded that for a better physician stakeholder buy-in, it was important that we compromise and not use PROMs as the sole method for measuring performance or level of healthcare delivery in any of our clinical specialties.
In mid-2019, I had an opportunity to participate in a discussion on Patient-Reported Experience Measures (PREMs) with colleagues from South East Asia. It was a novel concept since culturally in Pakistan, there is a power dynamics between medical professionals and their patients. This is especially exacerbated when the added element of low literacy and finances is added. And even when a physician would like to take into account a patient’s experience and comfort, it is often not possible due to resource and time limitations versus demand for services (especially in not-for-profit private or government sector facilities). Nevertheless, PREMs cannot be condoned altogether.
To add further to this, a need was also felt to have some measurement from the administrative perspective of the infrastructure availability, resource optimisation and the hospital processes while measuring hospital performance. All of this brainstorming led to an idea of measuring quality through four perspectives: administration, physician, patient and staff (see Supplement for further elaboration). This idea was agreed on as our future direction and published in our 2019 annual report.
While the exercise for measuring quality from various perspective was going on, a parallel activity was conducted to execute TDABC for a few identified medical conditions. Time-Driven Activity-Based Costing (TBABC) is a costing method that calculates unit cost of any service on the basis of the time required to complete each step in the process to deliver that service, and the unit cost of supplying resources for that service. Although it was a very insightful exercise, it was not feasible for us to carry out TDABC for the hundreds of medical conditions seen by our 30 clinical specialties. Just from the few medical conditions studied, it was evident that cost per service per patient had to be part of any framework measuring performance or healthcare delivery at our institution. A reasonable approach for us was to consider service cost calculated by our finance personnel through their traditional methodology.
Lastly, for a charity-based institution such as ours, we cannot afford to forget or forgo volumes since our donors would like to maximise the number of patients served while providing quality care. This is also part of Indus’ motto. In fact, our Board of Directors strongly feel that if volumes are appropriate then the cost-effectiveness (cost per patient per service) naturally improves. So in our situation, we combine the service volumes with number of beneficiaries on a regular basis to have a closer view of the services.
Challenges faced
Our hospital’s performance framework is based on three pillars, volumes (service volumes and patient volumes), cost (total cost of a service and cost of service per patient) and quality (from all four perspectives; administration, physicians, patient and staff). However, it was not an easy task to develop key performance indicators (KPIs) for quality on the four perspectives through appropriate prioritisation, data collection methodology and data validation. It required consistent surveillance and collection and analysis of KPI data.
We thought it would be easier to begin work on our framework using volume and cost data that was already identified and measured. However, when we started work on it, we realised our volumes and costs were being measured on the basis of locations (ie, consulting clinics, wards, intensive care units) whereas the clinical heads of departments who had to be ultimately responsible and accountable for cost and volumes were working on the concept of clinical specialties and medical conditions based integrated practice units (IPUs) or programmes. Our operations and finance departments were unable to provide volumes and cost on the basis of clinical specialties. Any structural change of this magnitude on reporting in our Hospital Management Information System would require considerable financial as well as manpower resources; which we did not have. Instead, we worked on a stop-gap solution where raw data were provided to us by the information technology (IT) department and it was linked via a Microsoft Excel-based interface, mapping every volume and cost to the correct specialty or IPU. It took around 3 months to develop this interface, and another 3 months to validate that mapping was being done correctly. Wee disseminated our first 9-month cumulative report in April 2020 and have since transitioned to a clinical specialty related monthly report instead of location-based reporting.
For the quality aspect, the challenges were even greater since most of the KPIs were not defined in our Hospital Management Information System (HMIS) and data were not being recorded. A few KPIs for which data was available in the HMIS was analysed and included in our monthly reports. In early 2021, we made a list of 2059 quality-based KPIs based on the four perspectives for each type of service in each specialty or IPU. However, once again the challenge was that the data for most of the quality KPIs could not be retrieved directly from our HMIS. In order to decide where to start, our team had to assess each KPI to help in prioritisation of data collection, its methodology and data validation. At the completion of the first round of exercise, it was decided that for the quality pillar of hospital performance measurement, we needed an appropriate infrastructure to be developed in our HMIS; and only then could we work on prioritisation of KPIs, its data validation followed by actual data entry.
Current status and the way forward
For the past 3 years, the volumes and cost reports are being released on a monthly basis. This has resulted in improved faculty awareness of optimal resource utilisation to deliver clinical services. Service volumes, patient volumes, value of services rendered (VOSR) and VOSR per patient are reported along with variance from benchmarks (budgeted figures). Areas of improvement, if found, are translated into appropriate action items in a timely manner. This exercise has not only opened new avenues for clinical research by faculty but also has helped us understand various trends within any specialty, like significant increase in average length of stay and consequent increase in VOSR within infectious diseases were attributed to COVID-19 admissions. At times, the data have also helped us in taking appropriate management decisions. The increased cost of consumables due to inflation is regularly monitored and helps in revising benchmarks for next fiscal year appropriately.
Presently, we do not have sufficient data to comment on the relationship of volume or cost-effectiveness with quality. However, with management’s commitment to incorporating quality-related KPI data, module development is underway by our IT in close consultation with the medical directorate. Our IT is also redesigning the HMIS infrastructure so that the excel-based interface is eliminated and automated reports can be generated and analysed. As the modules develop, we will roll them out to other hospitals within our network and use it as this would be very useful for hospitals within our network to compare and contrast results and generate healthy competition. One of the limitations of this framework is that it is time consuming to develop. Moreover, it may not be applicable for another institute to incorporate Indus’ KPIs and use for comparison. The usefulness of this framework is when an organisation’s management self-reflects and determines the KPIs that best suit their institution. The process works when there is commitment and time is given to its development.
Conclusion
In this paper, we have shared our process of sifting through the numerous hospital performance measurement frameworks and models to come up with an approach that works for Indus Hospital and Health Network. This is a reasonable, feasible and doable approach for measuring hospital performance in all three dimensions of volumes, cost and quality. It does not suggest what KPIs should be formed but gives the liberty to various hospitals and institutes to design their own KPIs according to their specialties, services and medical conditions. This also holds true for the networks having group of hospitals as the standardisation of KPIs across various campuses is possible. Moreover, the spectrum is quite wide and flexible, and can accommodate KPIs from primary care to quaternary care depending on the needs of individual institutions.
Supplement
What to measure? Triad of volume, cost and quality
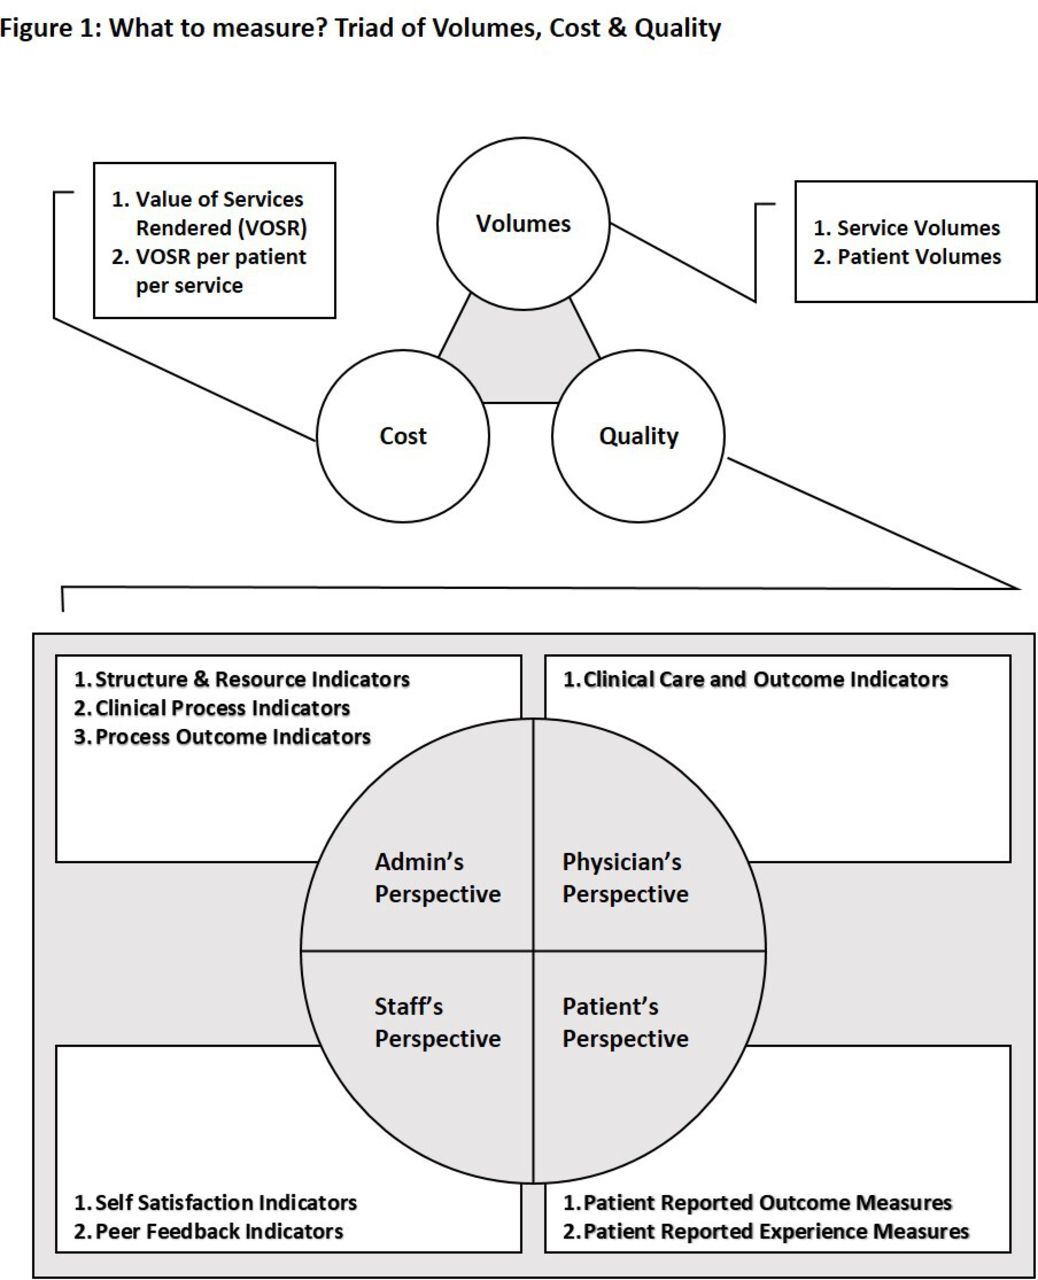
Apart from cost and quality, we decided that our framework should also include volume. (figure 1). We felt that volume does matter in overall hospital performance since it can affect quality and cost. In accounting for volume, we were careful to distinguish between service volume and patient volume since admitting the same patient multiple times for a medical condition may increase the service volume (admissions in this case) but is not a true reflection of increase in the number of unique patients. The value of healthcare is obviously decreased for a patient if she/he is being repeatedly admitted for the same ailment. Such a scenario would eventually alert administrators by driving up the service to patient volume ratio. In terms of the cost side, measuring service and patient volumes also gives us the opportunity to discretely calculate VOSR as well as cost per patient. The third pillar of our framework is quality measurement for which a 360° approach is adapted to ensure coverage of administration, physician, staff and patient perspectives.

What to measure? Triad of volumes, cost and quality.
At which level to measure? Specialty or medical condition-based model
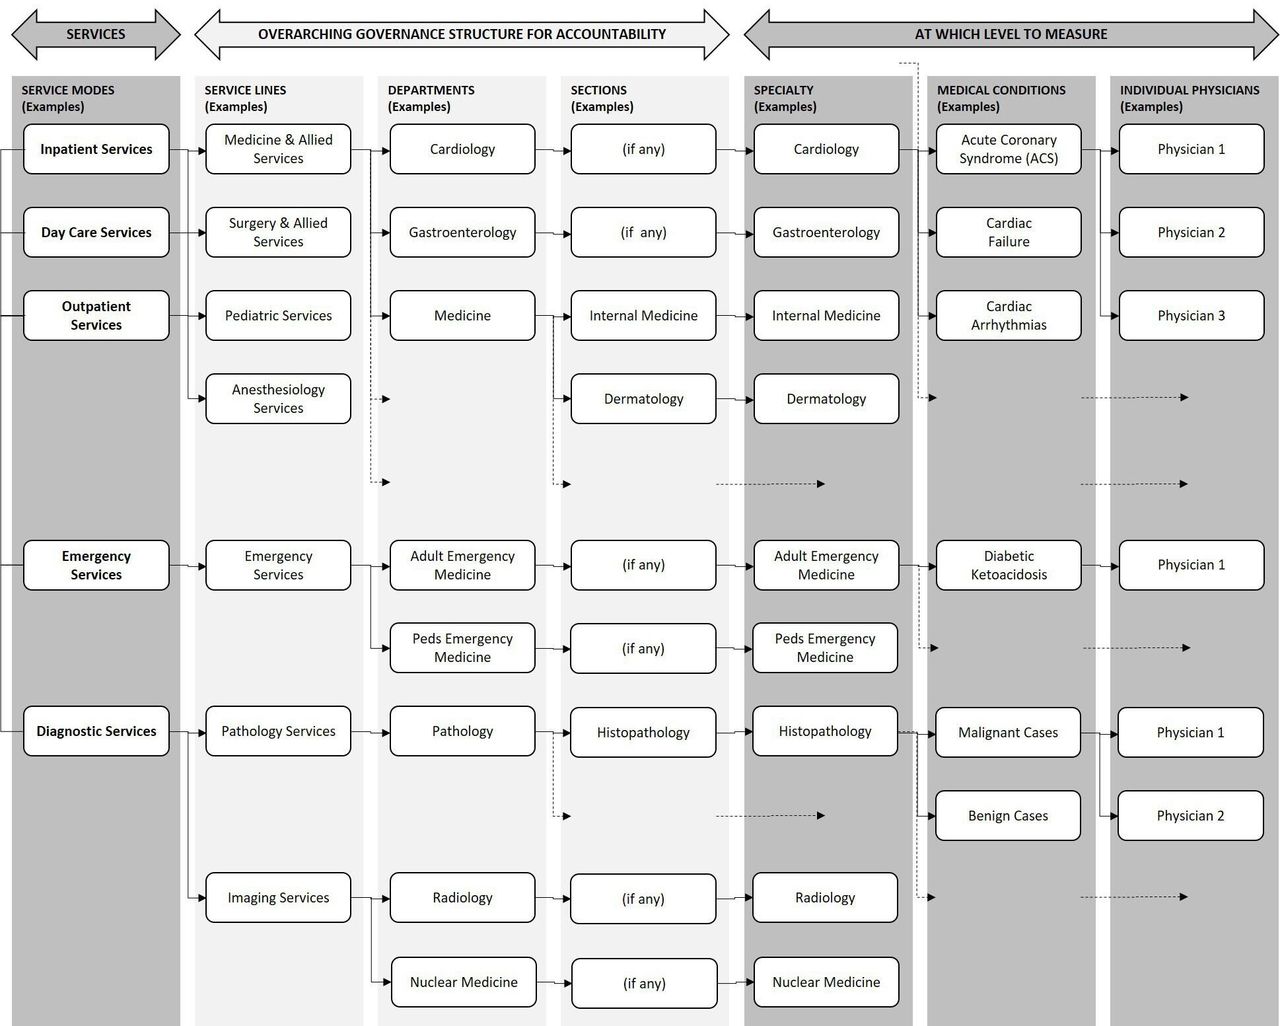
An important step is to identify the level at which measurements should be made. We implemented this measurement at the specialty level and have left the option of going to the medical condition or the physician level when this process has matured (figure 2). The traditional structure of service lines, departments, sections, etc is related to governance, accountability and responsibility. It is organisationally useful since it allows for growth as per need and the basic monitoring framework is not disturbed when transitions occur with only accountability and responsibility changes occurring. In instances where more than one specialty is delivering a service jointly for example, as an IPU dealing with a certain medical condition, the measurement of volumes, cost and quality is done at the medical condition level.

At which level to measure? Specialty or medical condition-based model.
From the administrative side, we incorporated operational service aspects (outpatient, inpatient, day care, emergency or diagnostic services) into our performance analysis and defined our unit of measurement as a combination of specialty with service mode. In figure 2, a few combinations have been illustrated. For example, Inpatient Cardiology Services were measured separately from Outpatient and Day Care Cardiology Services. Around 150 such combinations were defined and implemented in our framework combining service modes with specialties.
How to measure volumes and cost? EPIC model
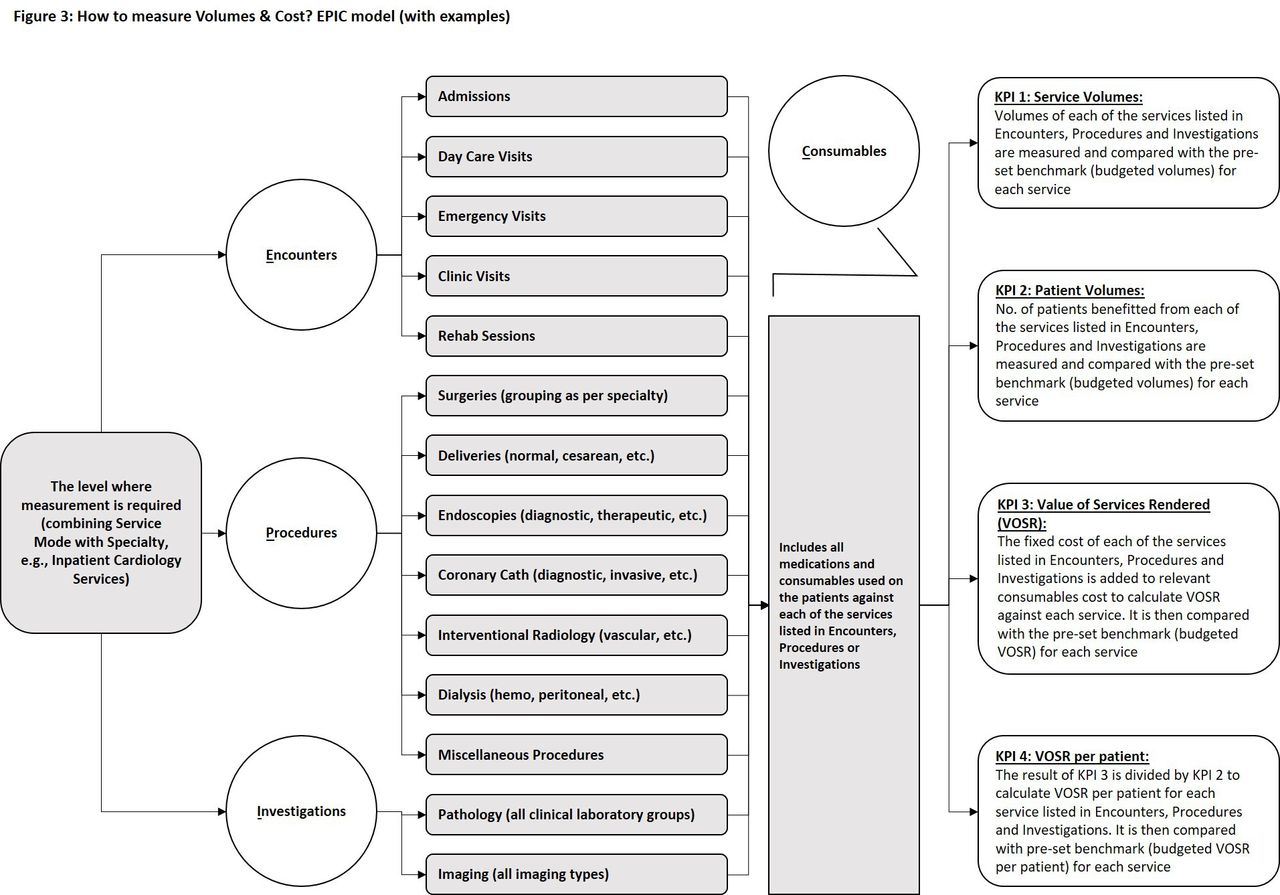
After defining the level where measurement is required (eg, inpatient cardiology services), the next step was to measure volumes and cost. We implemented an EPIC model for measuring volumes and cost in each specialty service, derived from four parameters: (A) Encounter, (B) Procedures, (C) Investigations and (D) Consumables (figure 3). For example, to assess inpatient cardiology performance, first the service volumes of encounter (admissions in this case), procedures (angiographies, angioplasties, etc) and investigations (lab, imaging, etc) were measured, then the number of patients benefited from each of these services were taken into account.

How to measure volumes and cost? EPIC model (with examples). EPIC, Encounter, Procedures, Investigations and Consumables. KPI, Key Performance Indicator.
Regarding cost measurement, it was not feasible for us with limited resources to carry out TDABC for the hundreds of medical conditions seen by a number of clinical specialties, therefore we adapted the service cost calculated by our Finance department on basis of direct labour, indirect labour, indirect material and overheads. The cost of consumables used directly on patients (direct material) was measured separately and added to the service cost to find out total VOSR. Last this VOSR was divided by the number of patients to find out average VOSR per patient. We believe that TDABC is a novel system21 22 and its gradual incorporation into our functional systems will lend to a more stable process-level cost-accounting practices in future.
In this way, all four KPIs, the service volumes, patient volumes, VOSR and VOSR per patient were calculated for 500+ combinations of different encounters, procedures and investigations with various specialties and service modes. Explaining these KPIs to clinical faculty and heads of department was a challenging task but with multiple sessions and capacity building, the benchmarks are now set for all four KPIs annually with clinical heads of departments at the time of budgeting. Variance from the benchmark is calculated on monthly basis and is shared with the heads of departments.
Dual cost centre allocation: advising versus implementing cost centre
To strengthen accountability and responsibility in a hospital performance framework, there needs to be checks and balances synergy between the advising and implementing service. Most often the latter being diagnostic services like radiology and laboratory. The advising specialty has to be accounted for meeting the benchmarks for volumes and cost while the implementing specialty is responsible to calculate their workload as per requests made, rationalise their human resource and equipment to ensure the smooth delivery of service and also identifying frequent unnecessary investigations. In our framework, we allocated both cost centres to each service, measured volumes and cost from both angles, and analysed the data accordingly.
How to measure quality? Four-dimensional approach
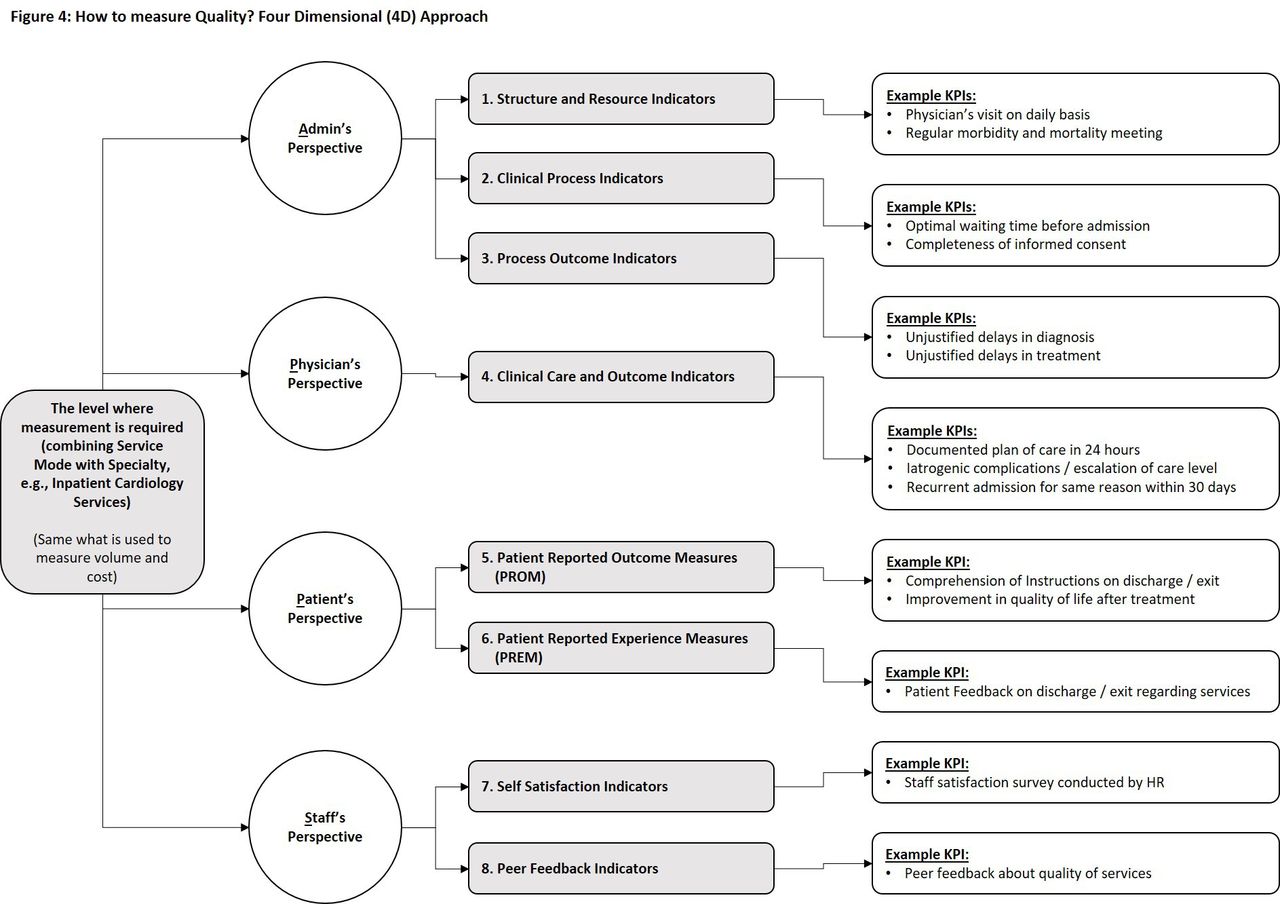
Quantitative measurement of quality has always been a challenge in healthcare. We devised a four-dimensional (4D) approach to ensure a 360° holistic view of quality. Eight types (or groups) of KPIs were identified in these perspectives, and actual KPIs were formulated within each group (figure 4). The responsibilities for data gathering, validation, calculation and compilation were clearly marked against each KPI along with weightage defined from levels 1 to 3 (3 being the most weighted KPI). The formula to calculate each KPI was derived by QIPS department with appropriate numerators and denominators. Wherever all entries could not be included, the sample size was taken as per international standards. The level where to measure these KPIs remained the same as for the volumes and cost, that is, combining specialty with service mode. For example, the measurement of quality was done separately for outpatient cardiology, day care cardiology and inpatient cardiology services just like we did for volumes and cost. In this way, around 2000+ KPIs have been formulated and will be monitored across the hospital once the development of appropriate infrastructure in HMIS to retrieve relevant data will be completed. The benchmarks are being set for each KPI and analysis will be made on basis of whether the KPI is met, partially met or not met. Quarter-wise trends will be analysed and shared.

How to measure quality? Four-dimensional (4D) approach. KPI, Key Performance Indicator.
Quality from the four stakeholder perspectives
Admin’s perspective
The hospital administration is responsible for the healthcare delivery system. Specifically, ensuring appropriate infrastructure, providing resources (be it space, equipment or human resource), defining processes and measuring outcomes from these processes. For example, while measuring quality for outpatient cardiology services, a physician’s output is undermined if space allocation, human resource ratios and equipment support is inappropriate or inadequate. Even in the presence of appropriate infrastructure, if the processes are not well defined, or not patient-friendly or physician-friendly, the outcomes may not be favourable. For example, an ill-defined process in outpatient consulting clinics may lead to unnecessary long waiting times, more no shows or higher left without being seen. Therefore, while setting KPIs for quality measurement, we have divided the admin’s perspective into three groups of KPIs (A) infrastructure, (B) processes and (C) outcomes, and have set KPIs within each group for each specialty service.
Physician’s perspective
No one can deny the importance of clinical practice guidelines (CPGs) in various specialties, and the need to follow these guidelines to ensure evidence-based medicine. Several specialty or medical condition KPIs at our institution are on the basis of these CPGs and help us in standardisation of healthcare delivery and evaluating physician-to-physician practice variance. In our framework, we have developed KPIs for clinical care, management and outcomes in each measuring unit (eg, outpatient cardiology) with the involvement of relevant faculty in line with available recognised literature and quality measurement resources.19 20
Patient’s perspective
It has been discussed in performance literature that KPIs set on CPGs may or may not be of value to the patient. For example, a patient may not be interested in knowing his/her HBA1c but would certainly be concerned if the physician talks about leg amputation due to diabetes. This has led to the idea of ‘Patient-Reported Outcomes Measures (PROMs)’ and is also the basis of value in healthcare. An International Consortium for Health Outcomes Measurement was founded by Porter who has been the concept lead for value-based healthcare. We have included this group of KPIs in our dimension of patient’s perspective incorporating various medical condition-based outcomes that matter to patients in our framework.
The second group of KPIs included in patient’s perspective of our framework is PREMs. The experience is different from outcome; a patient may be satisfied with his outcome but may remember an uncomfortable experience during the hospital stay. While measuring quality for hospital performance, such experience can never be ignored. It is not enough to be nice with patient; what is required is to understand the feelings of a patient throughout his/her journey. Whole journey of patient should be mapped to pick ‘Pain Points’, and this starts even before coming to the hospital. This may include starting from symptoms, visit plan, arrival, consult, diagnosis, treatment, admission, discharge or repeat visit. The patients in healthcare are like customers or consumers in other industries, and our processes should revolve around them. Clinical pathways, policies and standard operating procedures (SOPs) guide to drive a process on certain standard but usually address what suits to the hospital; customisation as per individual needs of a patient is required to be incorporated or implemented. We have developed a regular feedback mechanism for patients to register their experience with respect to the facility and processes to measure this important KPI. The Hospital Consumer Assessment of Healthcare Providers and Systems is one of the valuable resources for designing patient experience surveys.
Staff’s perspective
Designing the system and processes as ‘people-centred’ is even better than being ‘patient-centred’. It is a known observation that dissatisfaction of hospital employees lead to lack of motivation and passion, and the quality of healthcare delivery may drop abruptly, especially when not being watched by supervisors. This holds true for all kind of employees: physicians, junior doctors, nurses, support staff, etc. However, unfortunately opinion from employees is hardly taken into account and some institutions take it for granted. Therefore, we have included regular staff satisfaction survey by human resource department in our quality dashboard.
Another angle in staff’s perspective that helps in quality improvement is ‘peer feedback’. Better coordination among various health professionals and specialties always lead to smooth continuation of care. Peer feedback is an important tool to assess this aspect at individual or specialty level and should be performed periodically in an institute. Incorporating this in framework ensures our holistic concept of quality measurement for each specialty service.
Data availability statement
Data sharing not applicable as no datasets generated and/or analysed for this study.
Ethics statements
Patient consent for publication
Acknowledgments
The author would like to acknowledge Dr. Naila Baig-Ansari, ex-Chair Research, Indus Hospital and Health Network, for providing invaluable help with critically reviewing the manuscript.
References
Footnotes
Contributors AA is the sole author.
Funding The authors have not declared a specific grant for this research from any funding agency in the public, commercial or not-for-profit sectors.
Competing interests None declared.
Provenance and peer review Not commissioned; externally peer reviewed.