Article Text

Abstract
Background Efforts to reduce barriers and disparities faced by marginalised physicians are limited by a lack of data on the current diversity of the Canadian physician workforce. We aimed to characterise the diversity of the Albertan physician workforce.
Methods This cross-sectional survey, open to all Albertan physicians from 1 September 2020 to 6 October 2021, measured the proportion of physicians from traditionally under-represented groups, including those with diverse gender identities, disabilities and from racial minorities.
Results There were 1087 respondents (9.3% response rate); of whom 33.4% identified as cisgender men (n=363), 46.8% as cisgender women (n=509) and less than 3% as gender diverse. Fewer than 5% were members of the LGBTQI2S+community. Half were white (n=547), 4.6% were black (n=50) and fewer than 3% were Indigenous or Latinx. Over one-third reported a disability (n=368, 33.9%). There were 303 white cisgender women (27.9%), 189 white cisgender men (17.4%), 136 black, Indigenous or person of colour (BIPOC) cisgender men (12.5%) and 151 BIPOC cisgender women (13.9%). Compared with BIPOC physicians, white participants were over-represented in leadership positions (64.2% and 32.1%; p=0.06) and academic roles (78.7% and 66.9%; p<0.01). Cisgender women had less often applied for academic promotion than cisgender men (85.4% and 78.3%, respectively, p=0.01), and BIPOC physicians had been denied promotion more frequently (7.7% compared with 4.4%; p=0.47).
Conclusion Many Albertan physicians may experience marginalisation through at least one protected characteristic. There were race-based and gender-based differences in experiences of medical leadership and academic promotion which may explain observed disparities in these positions. To increase diversity and representation in medicine, medical organisations should focus on inclusive cultures and environments. Universities should focus efforts on supporting BIPOC physicians, especially BIPOC cisgender women, in applying for promotion.
- career
- clinical leadership
- medical leadership
Data availability statement
Data are available on reasonable request. Select data are available upon reasonable request - as providing all the data would be identifying.
Statistics from Altmetric.com
Introduction
Diversity among the physician workforce is associated with improved outcomes for patients1 and trainees.2 In addition, a lack of diversity among physicians is an issue of justice, as it may signal an unequal distribution of barriers3 or discrimination4 that disadvantage specific groups of physicians. While data on physician sex are systematically collected by the Canadian Institute of Health Information,5 data on other protected characteristics such as race, ethnicity, ability and gender identity is unknown or estimated for Canadian physicians.6–8 Further, while cross-sectional studies have found that some demographic groups such as women9 or black10 physicians are under-represented in medical leadership and academic positions relative to their total proportion in the physician workforce, these data are also not routinely collected. This lack of data prevents identification and therefore mitigation of gaps and barriers experienced by under-represented groups in recruitment, admission, retention, hiring and promotion of physicians.
The aim of this study was to characterise the diversity of physicians currently working in Alberta, including their leadership roles and academic appointments. Describing representation in the physician workforce can be leveraged to improve hiring processes, reduce barriers for marginalised physicians, direct advocacy and focus future research efforts. These data were collected as part of a larger survey of Alberta physicians.
Methods
Study design and ethics
This manuscript describes a subset of results characterising the diversity of the physician workforce collected during a larger, cross-sectional survey that was circulated to all physicians in Alberta. The survey was developed by a diverse team of physicians, students and researchers at the University of Calgary; this team included First Nations, Métis, settler and racial minority people. All respondents provided informed consent and participation was uncompensated, anonymous and voluntary. This manuscript is structured according to the Checklist for Reporting Results of Internet E-Surveys11 and Consolidated Criteria for Reporting Qualitative Research12 guidelines for reporting survey and qualitative research, respectively.
Survey development and description
The survey was developed from existing literature and in consultation with multiple stakeholders, including the University of Calgary Cumming School of Medicine’s Office of Professionalism, Equity and Diversity, the Department of Medicine’s Anti-Racism Task Force and Equity and Diversity Working Group, Indigenous medical students and faculty members, Alberta Health Services’ Employee Relations and Medical Affairs, and physicians with lived experience of marginalisation. The survey was pilot tested for face validity, length, completeness and clarity by twenty physicians who were diverse in race, ethnicity, Indigenous status, gender identity, career stage, practice setting and specialty. Items were added, revised, removed or otherwise adapted based on written feedback. The survey was administered using Qualtrics (Qualtrics, Provo, Utah, USA). Participants were not allowed to return to previous questions or sections. Respondent IP addresses were not recorded, to protect participant anonymity.
The survey contained seven domains: demographics, workplace characteristics, leadership roles, gender-based workplace harassment and discrimination, race-based workplace harassment and discrimination, explicit anti-indigenous bias and implicit anti-Indigenous bias (online supplemental appendix 1). The results of this manuscript focus on describing the demographics, workplace characteristics, and leadership and academic roles of Albertan physicians. The results of other sections are reported elsewhere.
Supplemental material
The number of survey questions varied by participant based on previous responses (minimum 65, maximum 175). All questions included a ‘prefer not to answer’ response option and, where relevant, a free-text response. There were 25 demographic questions, aimed to understand the diversity of physicians based on protected characteristics in the Canadian Charter of Rights and Freedoms. Phrasing of items and responses was based on best practices for sensitive survey questions.13 14 Workplace characteristics contained a maximum of 19 items to understand the physician’s practice discipline, location, and, where relevant, academic positions. Promotion was defined as advancement in faculty rank. Leadership roles included any self-defined position of responsibility, and this domain contained a maximum of 13 items about the number, type, time commitment and compensation for leadership positions.
Participants and recruitment
All 11 688 practising physicians in Alberta were included in the sampling frame. The survey access link was circulated in the September 2020 newsletter of the Alberta Medical Association (reach of 14 000, which may include retired physicians and duplicate email addresses), the College of Physicians and Surgeons of Alberta (11 730 recipients), and the Alberta Health Services newsletter (9158 recipients). The social media accounts of these organisations directed potential participants to these newsletters to complete the survey. The survey was open from 1 September 2020 to 15 October 2020 (6 weeks).
Definitions and terminology
BIPOC refers to black, Indigenous and people of colour and was used to refer to physicians who are minoritised based on race. We have combined this group to examine intersectional identities of race and gender while protecting the anonymity of participants from smaller demographic categories; however, this is a heterogeneous group with a diverse range of lived experiences.
In this project, we use the term ‘other ability’ along with ‘disability’ to refer to physical or cognitive health conditions that often require adaptations for people to navigate their environments. There are different opinions among people with disabilities/other abilities about the most inclusive language to discuss this diverse group of health conditions. We aim to be person-first and strengths-based when discussing disabilities and other abilities in this work, but acknowledge that preferences differ between communities and individuals.
Analysis
Complete data was available to a single member of the study team (SMR) to reduce risk of participant identification. When necessary, only relevant, non-identifiable data was shared among team members in aggregate. Response rates per subgroup were calculated using Albertan data from the Canadian Institute for Health Information, which only reports binary, self-identified sex of physicians.15 Data on the race and Indigenous status of Canadian physicians and the general demographic information of Alberta was obtained from the Statistics Canada 2016 or 2012 Census, where available.8 16 17
Data are primarily reported using median and IQR. Responses were stratified by self-reported gender identity, race and intersectional identities of gender identity and race (white cisgender men, white cisgender women, BIPOC cisgender men and BIPOC cisgender women). χ2 tests were used to compare count outcomes for categorical data, the Wilcoxon rank-sum test was used to compare non-parametric continuous measures between two groups and Kruskal-Wallis tests were used to compare non-parametric continuous measures between intersectional identities. Data analysis was performed using Stata (version 15.1).
Results
Work and personal demographics
There were 1087 responses, for an overall response rate of 9.3%. Demographic and work characteristics of respondents are presented in tables 1 and 2. One-fifth of respondents did not report their discipline of practice (n=212, 19.5%); 43.7% of respondents were in medical disciplines, and 33.4% were family physicians. The response rate for family physicians was greater than for medical and surgical specialists (15.4% compared with 8.5% and 7.8%, respectively). Most participants worked in a metropolitan centre (67.6%, n=644).
Demographic and workplace representation of the survey cohort, compared with known characteristics of Albertan or Canadian physicians and the general population of Alberta
Gender identity and race of participants. (% by column, row where applicable)
Of all respondents, 33.4% identified as cisgender men (n=363, response rate 5.3%), 46.8% as cisgender women (n=509, response rate 11.8%) and fewer than 25 individuals as either transgender, non-binary gender, gender diverse, two-spirit or a gender that was not listed (table 1). Of the latter group, less than half had shared their gender identity with their physician leader, coworkers or patients. Between 25 and 50 individuals were members of the LGBTQI2S+community and about two-thirds had shared their sexual orientation with their physician leaders or co-workers and less than one-fifth shared their sexual orientation with patients.
Half of respondents were white (n=547), less than 5% identified as each of black, Indigenous, Hispanic, Latinx, Middle Eastern, or Southeast Asian, and less than 10% identified as either South or East Asian (table 1). There were 23.4% of participants who were white cisgender men (n=194) and 39.2% who were white cisgender women (n=326)(table 2). Notably, 16.7% of respondents preferred not to disclose their race or gender identity.
There were 33.9% of respondents who reported having a disability (n=368), mostly commonly a mental health disorder (n=80, 8.6%), followed by a chronic illness (<5%)(table 1). Overall, 31.8% and 17.8% of respondents considered themselves a visible and non-visible minority, respectively (n=346, n=194).
Leadership roles
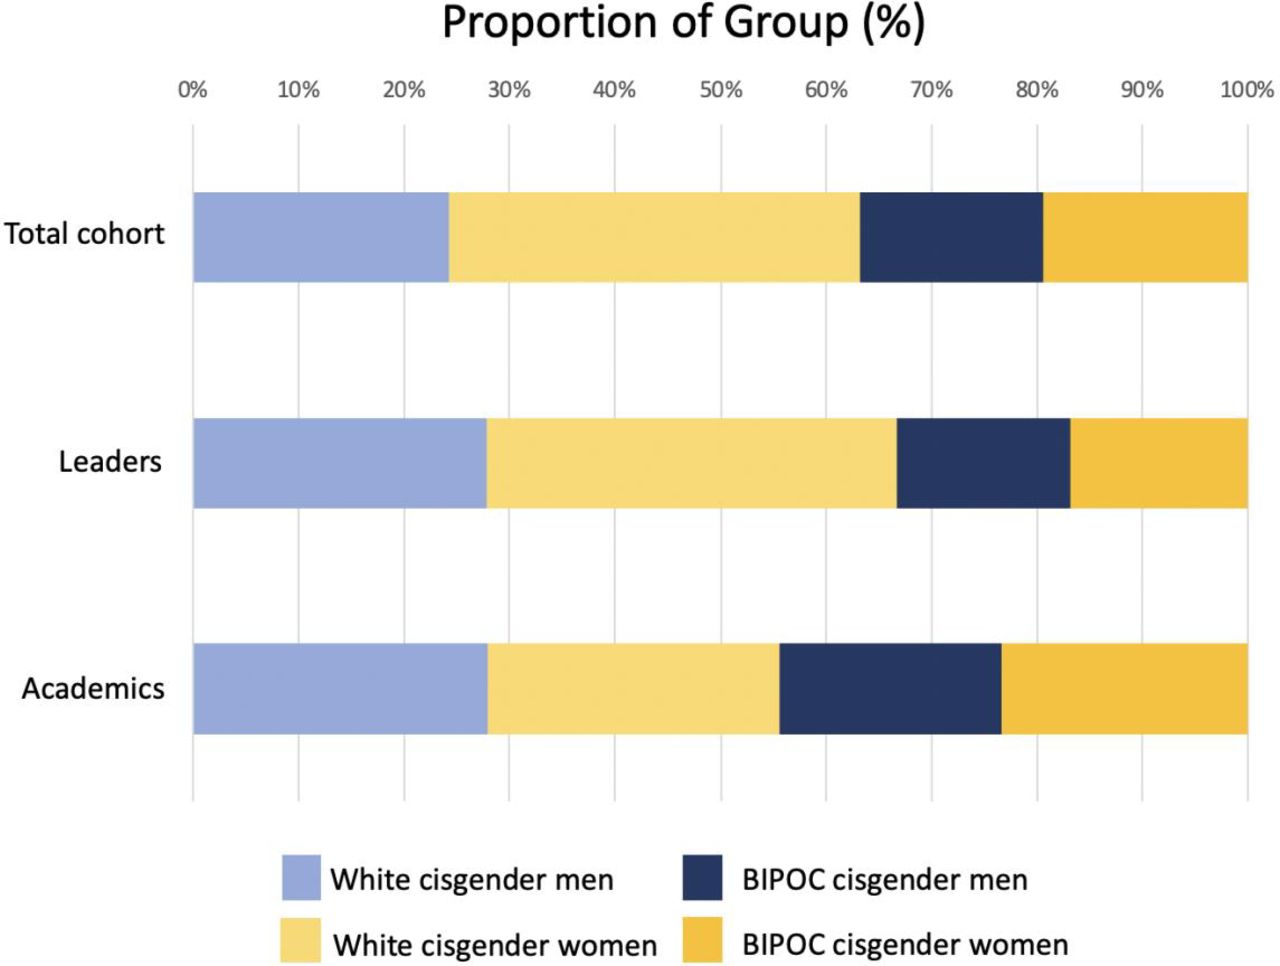
There were 386 respondents who held a current leadership position (35.5%) (table 3). Among our participants, there was a similar proportion of cisgender women and cisgender men leaders (41.1% and 46.0%; p=0.15). Though 50.3% of the study sample were white, 64.2% of participants with leadership roles were white, compared with 32.1% of leaders who identified as BIPOC (p=0.06; table 3; figure 1). Fewer than 5% of persons in leadership positions were black and fewer than 3% were Indigenous. As a proportion of respondents in their race and gender identity group, white cisgender men respondents occupied the highest proportion of leadership roles, though this difference did not reach statistical significance (53.4%, n=101 of 189; p=0.15; table 3; figure 2A).

Proportion of total cohort, leadership roles and academic positions occupied by each demographic group. BIPOC, black, Indigenous or person of colour.

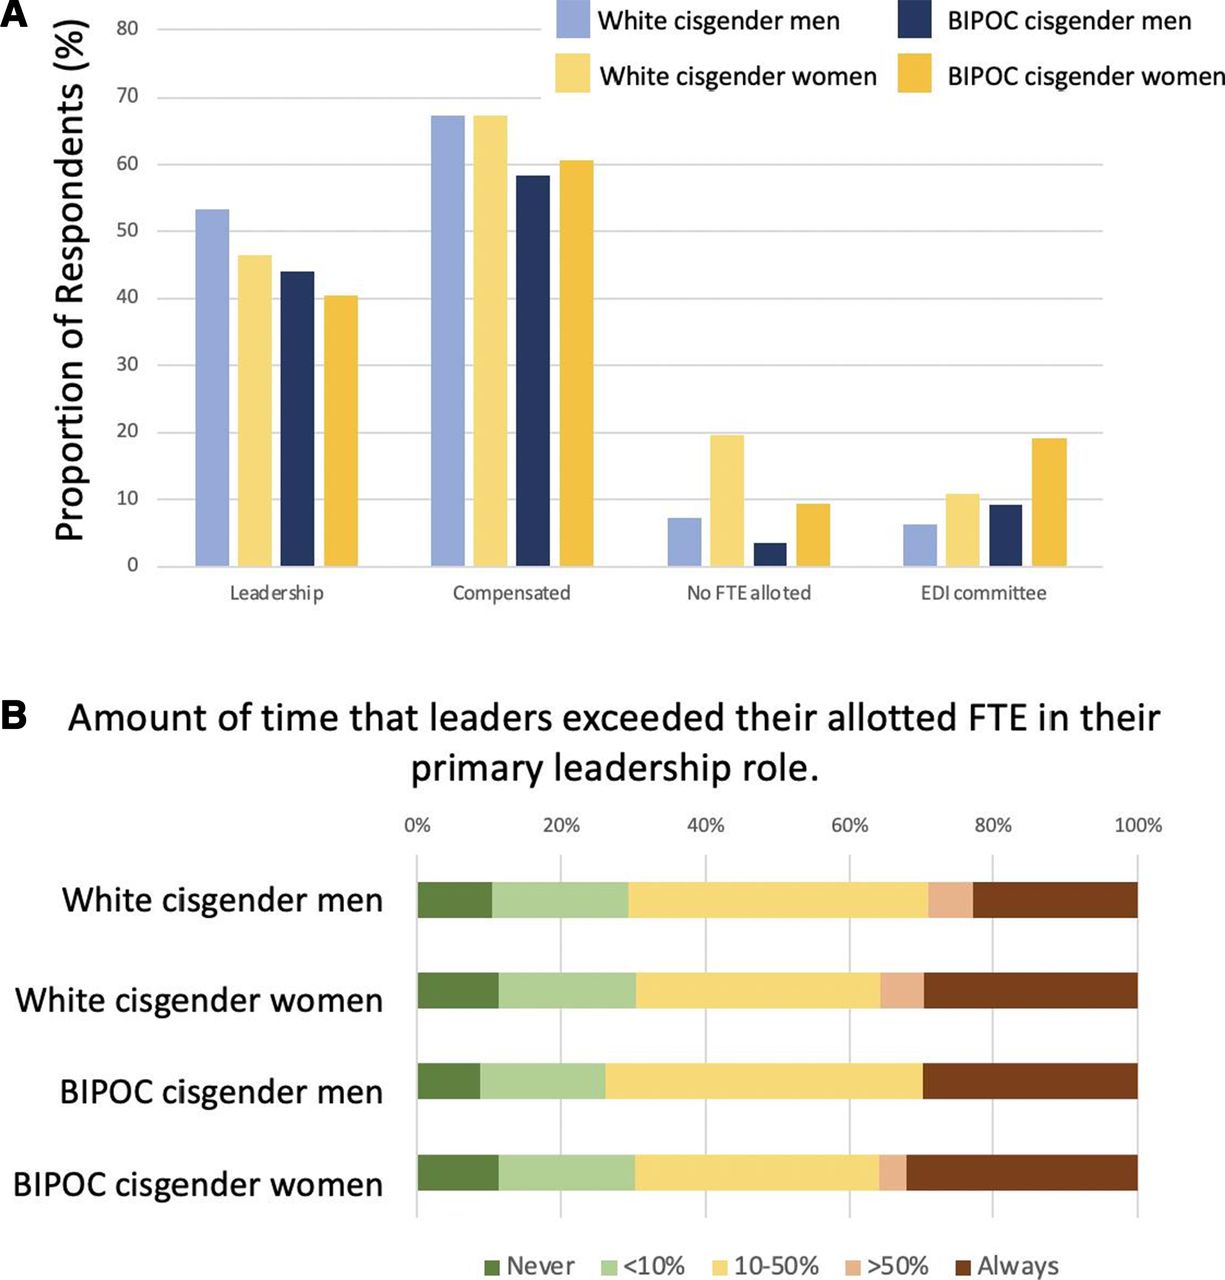
Leadership roles and characteristics by gender identity and race category. (A) Proportion of each demographic group in leadership roles and selected characteristics of these roles; (B) Amount of time that leaders exceeded their allotted FTE in their primary leadership role by gender identity and race. BIPOC, black, Indigenous or person of colour; FTE, full-time equivalent.
Characteristics of leadership and academic positions by participant demographics
Most leadership roles were compensated (n=247, 64.0%; table 3; figure 2A) and compensation did not differ by race, gender identity or intersectional identities (p=0.53, p=0.66, and p=0.53, respectively). Fewer cisgender women had a full-time equivalent (FTE) allocation for their primary role compared with cisgender men (p=0.002; figure 2A). Over a quarter of physician leaders always exceeded their compensated FTE for their leadership role (figure 2B); exceeding the compensated FTE was least common for white cisgender men compared with other groups (figure 2B).
Thirteen per cent of participants were on an equity, diversity or inclusion (EDI) committee (n=95; figure 2A). BIPOC and cisgender women respondents were more often on an EDI committee than white and cisgender men participants (p=0.03 and p=0.004), and BIPOC cisgender women were more often on EDI committees than any other group (p=0.001).
Academic positions
There were 637 participants (58.6%) who had an academic affiliation (table 3; figures 1 and 3). There was no difference in the proportion of cisgender men and women who had academic affiliations (69.7% and 72.7%, respectively, p=0.28); however, a greater proportion of white respondents had academic positions compared with BIPOC respondents (78.7% and 66.9%, p<0.01). There were fewer than 25 total black and Indigenous physician respondents with academic affiliations (<5%).
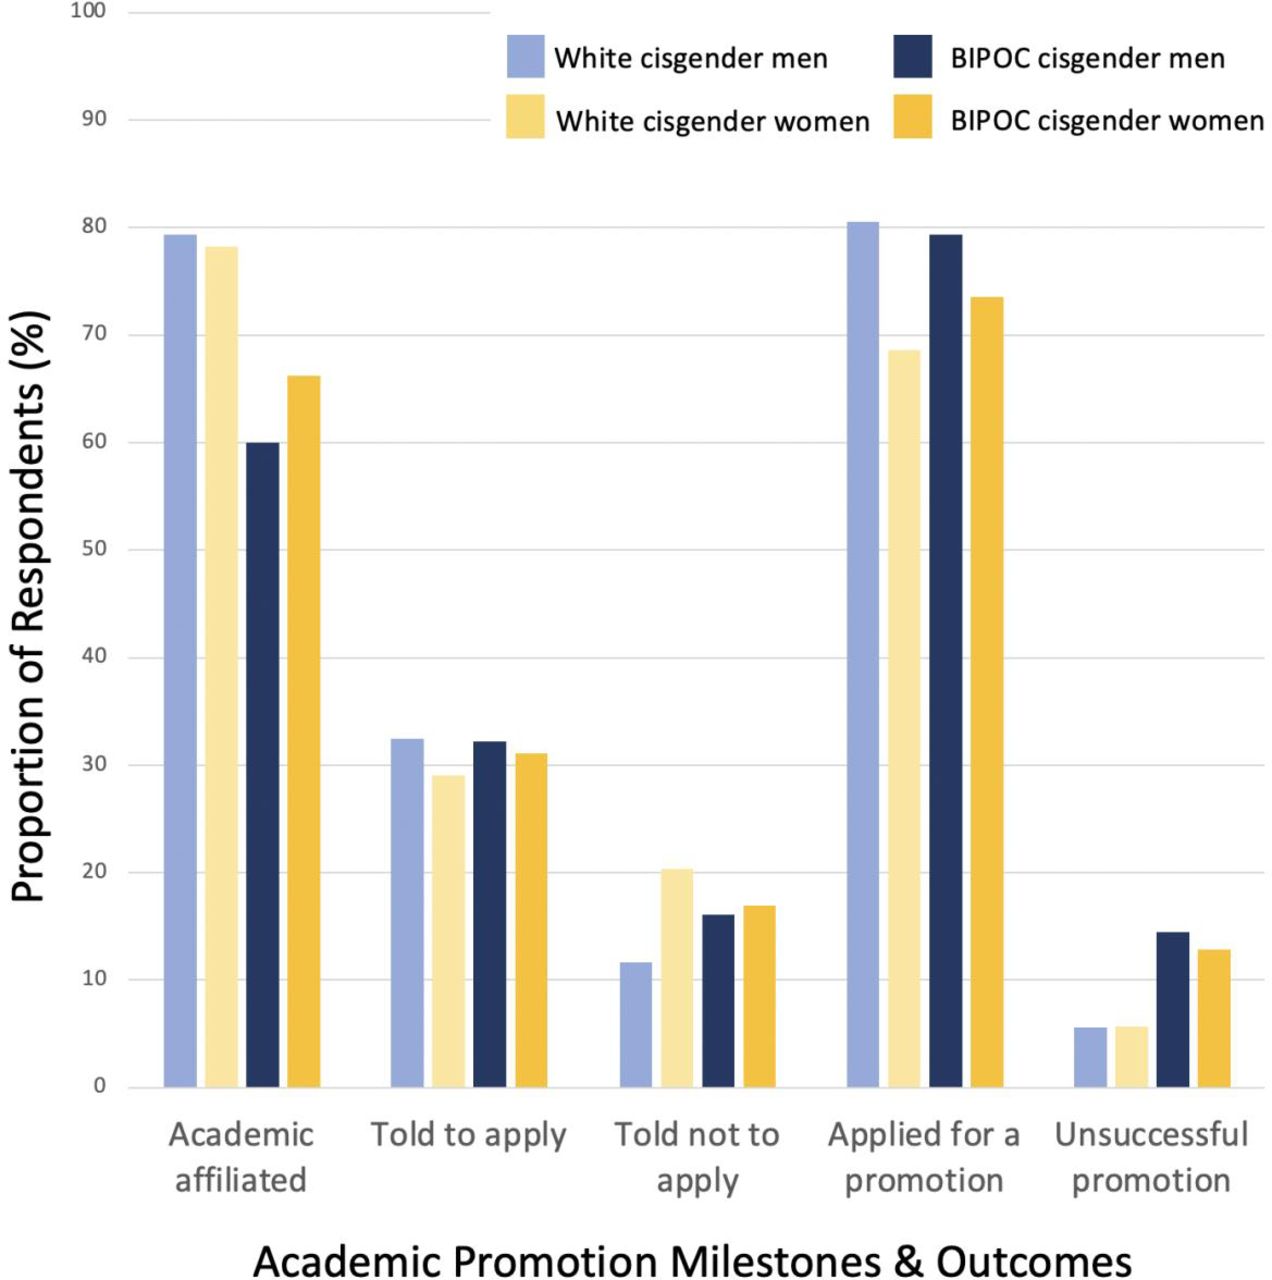
Experiences of academic promotion and outcomes by gender and racial identity. BIPOC, black, Indigenous or person of colour.
A greater proportion of cisgender women reported being told not to apply for promotion compared with cisgender men (19.8% (n=71) compared with 12.8% (n=32), p=0.03)(figure 3). Most participants commented that they were told by their leadership that they were not ‘ready’, not qualified, nor did not have enough publications. Seven cisgender women reported maternal discrimination related to their promotions; examples included being told that ‘women tended to ‘not be successful in academic positions because they had competing priorities’’, being told not to apply ‘because I was going on maternity leave within the next year’ or being told that her promotion would be ‘delayed due to maternity leaves, because ‘I took time off’ even though I was still quite academically productive’. One participant was advised against applying for a promotion due to having obtained academic credentials obtained in another country and three were discouraged specifically due to their health issues.
Among those with academic affiliations, a greater proportion of cisgender men with had applied for an academic promotion than cisgender women (85.4% and 78.3%, respectively, p=0.01; figure 3). BIPOC physicians had a greater prevalence of unsuccessful promotion compared with white physicians, though the increased prevalence was not statistically significant (7.7% compared with 4.4%; p=0.47)(figure 3).
Discussion
This cross-sectional survey of Albertan physicians reports novel, baseline demographic data about the diversity of the physician workforce and begins to characterise different experiences of leadership and academia based on demographic characteristics. While the proportion of Albertan physicians who are white is lower than the proportion of white Albertans in the general population, our data suggest that white physicians may be over-represented in both leadership and academic roles. In addition, white cisgender men may be under-represented on committees that aim to address EDI. Importantly, we found that certain demographic groups may be more often discouraged from applying for promotions and may be more likely to be unsuccessful in application for promotion; both factors may contribute to under-representation of BIPOC physicians and, in particular, BIPOC cisgender women in academic leadership. These results should inform targeted interventions to address lack of diversity among physicians and can be used as a baseline for evaluation of these interventions.
We identified race-based differences in leadership roles. While more than two-thirds of white physicians had a leadership position, less than half of black physicians and about 60% of Asian and Middle Eastern physicians had leadership roles. Though our results are not adjusted for time in practice, this under-representation of black physicians as leaders is apparent; despite accounting for 2.2% of all practising physicians, there have been no black leaders of the Canadian Medical Association, no black medical school deans, and no black inductees to the Canadian Medical Hall of Fame.10 Similarly, Association of American Medical Colleges data shows that the proportion of medical school deans from under-represented races has stagnated between 10% and 15% for the past decade.18 Further, our data show that while BIPOC leaders held a greater number of leaderships roles than white leaders, a lesser proportion of BIPOC physician leaders were compensated for their positions compared with white physician leaders.
Overall, our data suggest the need for strategies to recruit and retain physician leaders from racial minority groups, especially BIPOC women, who had lowest leadership attainment in our study. These strategies could include quotas,19 separate application streams,20 opt-in selection,21 evidence-based faculty development programmes22 and adoption of best practices in recruiting under-represented groups.23 Medical leadership training programmes should be examined for bias, exclusion and effectiveness in under-represented groups. For example, preliminary research on the professional identity work performed in formal leadership training programmes for medical leaders suggests that these identities are fluid and respond to organisational contexts22; further research on how this identity work manifests for physicians from under-represented groups who experience isolation, discrimination and bias in the organisational context may provide insights on how to tailor existing supports and training for these groups as they enter medical leadership. Existing frameworks for identifying, selecting and training medical leaders24 should be critically evaluated for potential biases and evaluated for their effectiveness in under-represented groups. Lastly, medical organisations should create systems-level policies to ensure that all leaders are compensated appropriately to address potential race and gender biases.
Similarly, we report gender-based and race-based differences in academic positions. White cisgender men and women were over-represented in academic positions compared with their proportion in the study sample; while 50% of our sample identified as white, 66% of academic physicians were white. The over-representation of white physicians in academia, especially in more senior positions, is commonly reported in the literature; in the USA, 56.2% of all practising physicians, 63.1% of medical school faculty and 75.6% of professors are white.25 Similarly, men were over-represented in senior academic positions in our sample, making up only 39.2% of those with an academic affiliation but 77.1% of clinical professors and 56.3% of professors. Our data suggest that this over-representation of white cisgender men is multifactorial. White cisgender men reported the lowest rate of being discouraged from applying for an academic promotion, cisgender men were more likely to apply for a promotion than women, and white physicians were most often successful in being promoted. BIPOC physicians were nearly twice as likely to report being unsuccessful in a promotion application compared with their white counterparts. These findings emphasise the need for bundled interventions to address the multiple causes of race-based disparities in academia.
Many physicians unknowingly work with another physician who is a sexual or gender minority; we estimate that between 1% and 3% of Albertan physicians have a non-binary gender identity. Our estimate is greater than the 0.7% of American medical students, 0.3% of practising physicians and 0.06% of Canadian medical students previously reported to identify with a gender identity that differed from their sex assigned at birth.6 26 27 Similarly, we report that between 1% and 5% of Albertan physicians are members of the LGBTQ +community (Lesbian, gay, bisexual, transgender; the ‘plus’ refers to the multiple additional identities included in this heterogeneous group of people who have a sexual orientation that is not heterosexual and/or gender identity that is not cisgender), less than the 7.7% of American medical students but similar to the 3.8% of physicians and 5.4% Canadian medical students who reported being a member of the LGBTQ+ community.6 26 27 Among our respondents, one-third were not open about their sexual orientation with coworkers and more than half had not shared their gender identity with colleagues, which is very similar to results of other studies of sexual and gender minority medical students.28 In one study of North American medical students, one of the most common reason for not disclosing one’s sexual orientation or gender identity to other physicians was due to fear of discrimination.28 29 As a result, nearly 80% of participants censored themselves at work to avoid accidentally disclosing their gender identities.29 Overall, these data highlight the importance of developing a workplace culture that is accepting and the need for professional competence in non-traditional gender and sexual identities.
One-third of our participants reported an other ability or disability, including nearly 9% of our sample who reported having a mental illness. This result is more than twice the 12.5% of Albertan adults who reported having a disability in 2012.30 The reported prevalence of disability in the United States is 2.7% in medical students and 3.1% among practising physicians,27 31 32 while 3.5% of Canadian medical students reported having a disability in 2012.6 Observed differences in prevalence of disability among physicians may be explained by under-reporting31 and dynamic definitions of what constitutes a disability.32 Literature on physicians with disabilities suggests that these physicians experience multiple barriers in the workplace that are due to structural and personally mediated ableism.32 33 These barriers and their proposed solutions are expected to differ by clinical setting and type of disability.32 Further study to understand the experiences of physicians with disabilities is needed to address these barriers among practising physicians.
Our study has important limitations. The most important limitation is response bias; for example, early career physicians, rural physicians and cisgender women respondents were over-represented among our respondents. This over-representation of women respondents is in-keeping with other studies.34 The second critical limitation is our low response rate, which limits our ability to make definitive statements about the diversity of Albertan physicians. Due to low numbers of certain subgroups of respondents, we had to combine groups to protect participant anonymity; combining these groups can result in collider bias due to heterogeneity among respondents who are incorrectly combined, which is most likely to occur among the ‘BIPOC’ category and may bias results for this group toward null effects. In addition, our results may be confounded by social desirability bias, where respondents adjust their answers to be more favourably viewed.
This study represents the first attempt to enumerate the diversity of Canadian physicians beyond binary sex, including data on intersectional identities. These data should inform and evaluate efforts to increase representation of minoritised physicians by tracking changes over time or comparing leadership roles to current demographics in the general physician workforce. In addition, these data re-emphasise the importance of cultural safe, professional workplaces, given the diversity of identities among physicians. Physicians and trainees should understand and use appropriate terminology and language to avoid unintentional harm to their colleagues, who can be expected to hold diverse identities. Continuing medical education that addresses our evolving understanding of these identities could be helpful.
Further, our data suggest that observed differences in academic attainment occur along the entire career spectrum including at appointment, through support for promotion, and likelihood of successful promotion application. Interventions to address these disparities will be complex and must be multifaceted, but could include opt-in selection for promotion,21 promotion mentorship programmes, and masked review of applications.
Conclusion
This study is consistent with other literature that the medical workforce in Alberta remains predominantly made up of white, cisgender men, heterosexual and physicians without disabilities. Physicians with these characteristics are further over-represented in leadership and decision-making positions. Our data further suggest that BIPOC cisgender women are least represented in academic leadership positions; this should be a targeted area of action for universities. Altogether, these data provide impetus for intentional efforts to reduce barriers for under-represented groups.
Data availability statement
Data are available on reasonable request. Select data are available upon reasonable request - as providing all the data would be identifying.
Ethics statements
Patient consent for publication
Ethics approval
This study was approved by the University of Calgary’s institutional ethics review board (REB20-1138).
Acknowledgments
Angela Unsworth, Mona Sikal, Marni Panas, Jamie Rice, Lisa Beesley, and Debrah Wirtzfeld from Alberta Health Services; Stephanie Usher from the Alberta Medical Association; Melissa Campbell and Nicole Kain from the College of Physicians and Surgeons of Alberta; for their assistance in design and/or distribution of the survey.
References
Supplementary materials
Supplementary Data
This web only file has been produced by the BMJ Publishing Group from an electronic file supplied by the author(s) and has not been edited for content.
Footnotes
Twitter @ShannonRuzycki
Contributors SMR, CB, SBA, JH-L and PR contributed to the planning, design, conduct, reporting and editing of the final draft of this project. SMR and PR performed the data analysis. SMR and JH-L wrote the first draft of the manuscript. SMR is responsible and the guarantor for the final manuscript.
Funding The authors have not declared a specific grant for this research from any funding agency in the public, commercial or not-for-profit sectors.
Competing interests None declared.
Provenance and peer review Not commissioned; externally peer reviewed.
Supplemental material This content has been supplied by the author(s). It has not been vetted by BMJ Publishing Group Limited (BMJ) and may not have been peer-reviewed. Any opinions or recommendations discussed are solely those of the author(s) and are not endorsed by BMJ. BMJ disclaims all liability and responsibility arising from any reliance placed on the content. Where the content includes any translated material, BMJ does not warrant the accuracy and reliability of the translations (including but not limited to local regulations, clinical guidelines, terminology, drug names and drug dosages), and is not responsible for any error and/or omissions arising from translation and adaptation or otherwise.