Article Text

Abstract
Background Red, amber, green (RAG) reports persist as the tool most commonly used by NHS trust boards to understand performance and gain assurance, despite statistical process control (SPC) being a more reliable way of presenting data over time. The aim of this study is to report board members’ feedback on an educational intervention focusing on the use of SPC in NHS trust performance reports, review the presence of SPC charts in performance reports and explore board members’ experience of behavioural changes in their board or fellow board members following the intervention.
Methods A 90-minute board training session in the use of SPC—Making Data Count—was delivered to 61 NHS trust boards between November 2017 and July 2019. This paper describes the approach taken with boards to enable them to understand the limitations of RAG reports and the benefits of using SPC and analyses the extent to which the Making Data Count training has led to boards adopting SPC. The paper provides quantitative analysis of the increase in SPC use across the 61 participating boards, summaries from the board evaluation forms and qualitative reflections of seven senior leaders from four boards who consented to participate in post-training interviews with an independent evaluator.
Results During the period covered by this study, 583 participants of board training provided feedback. 99% of respondents agreed that the training session was a good use of their time. 97% of respondents agreed that participating in the event would enhance their ability to make good decisions. A review of the presence of SPC charts in the board papers of the 61 trusts prior to the board training revealed that 72% contained 0–5 SPC charts. A review of the same trusts’ papers 6–12 months after the training revealed a significant increase in the presence of SPC with 85% of reports containing a minimum of six charts.
Conclusion The Making Data Count education intervention has increased the use of SPC in board reports and has had some self-reported impact on individual and collective behavioural changes by board members, including reducing the amount of time wasted by boards discussing insignificant changes in data and providing a clearer focus on those issues requiring board attention. Further research is required to see if this immediate impact is sustained over time and to identify the key enablers and barriers to organisational adoption of SPC by boards in the NHS.
- data
- improvement
- information
- variation
- performance
Data availability statement
All data relevant to the study are included in the article or uploaded as supplementary information. All data relevant to the study are included in the article.
This is an open access article distributed in accordance with the Creative Commons Attribution Non Commercial (CC BY-NC 4.0) license, which permits others to distribute, remix, adapt, build upon this work non-commercially, and license their derivative works on different terms, provided the original work is properly cited, appropriate credit is given, any changes made indicated, and the use is non-commercial. See: http://creativecommons.org/licenses/by-nc/4.0/.
Statistics from Altmetric.com
Introduction
Developing People Improving Care (DPIC),1 launched in 2016 by the National Improvement and Leadership Development Board following the Smith review,2 recognised the need to set out a long-term strategy to build improvement and leadership capacity and capability across the health and care system. It identified five evidence-based conditions common to high-quality health and care systems with cultures that equip and encourage people in NHS-funded roles to learn and deliver continuous improvement:
Condition 1: Leaders equipped to develop high-quality local health and care systems in partnership.
Condition 2: Compassionate, inclusive and effective leaders at all levels.
Condition 3: Knowledge of improvement methods and how to use them at all levels.
Condition 4: Support systems for learning at local, regional and national levels.
Condition 5: Enabling, supportive and aligned regulation and oversight.
The need for continuous improvement was also recognised in the 2019 NHS Long Term Plan.3 Senior leaders and boards commonly seek to understand how to make this ambition a reality in the organisations they lead and to enhance and develop leadership for improvement capability skills. A common request is help to use data more effectively in their decision-making.
Red, amber, green (RAG) reports are a simple and popular performance and assurance method of highlighting ‘at a glance’, which targets are (green) and are not (red) being met; they focus most people’s attention on the ‘failing’ red indicators, while indicators showing as amber or green are ignored.4 But by using this simple three-colour code and taking only a snapshot, RAG reports mask the important messages that come from looking at trends in data over time. Improvement can often be masked by ‘red’ performance and a deteriorating pattern missed due to performance being ‘green’. Their use as a basis for decision-making drives unhelpful behaviours. Time and resource are often wasted investigating two-point changes in the data, which are not significant, while patterns in data revealing significant deterioration and the need for action are missed—as is the opportunity to celebrate improvements, which may also be masked.
Statistical process control (SPC) is an analytical technique that plots data over time. It helps those making decisions understand variation and in so doing guides when and where it is appropriate to take action. SPC rules identify the unusual patterns in a dataset that are unlikely to have arisen by chance (special cause variation) and need to be reacted to and those that should be viewed as natural variation (common cause variation) and to which overreaction may misdirect valuable resources.5
Despite Benneyan et al 6 and Schmidtke et al 7 providing evidence that SPC yields insight into the data more quickly and in a way that is more understandable to lay decision-makers, few NHS trusts were using SPC charts as standard in their board and directorate reports when the Making Data Count Training Programme began in 2017. Most NHS boards considered that the RAG system provided their members with a strong governance framework on which to base their individual and collective decision-making.
By revisualising data presented as RAG as SPC charts, the important messages in the data are revealed. The Making Data Count training aimed to illustrate to board members the powerful messages that SPC could expose and how this could lead to more effective discussions and decisions.
The dangers of relying on RAG reports when making decisions and how SPC can be a more powerful are illustrated by this example (figures 1–3).
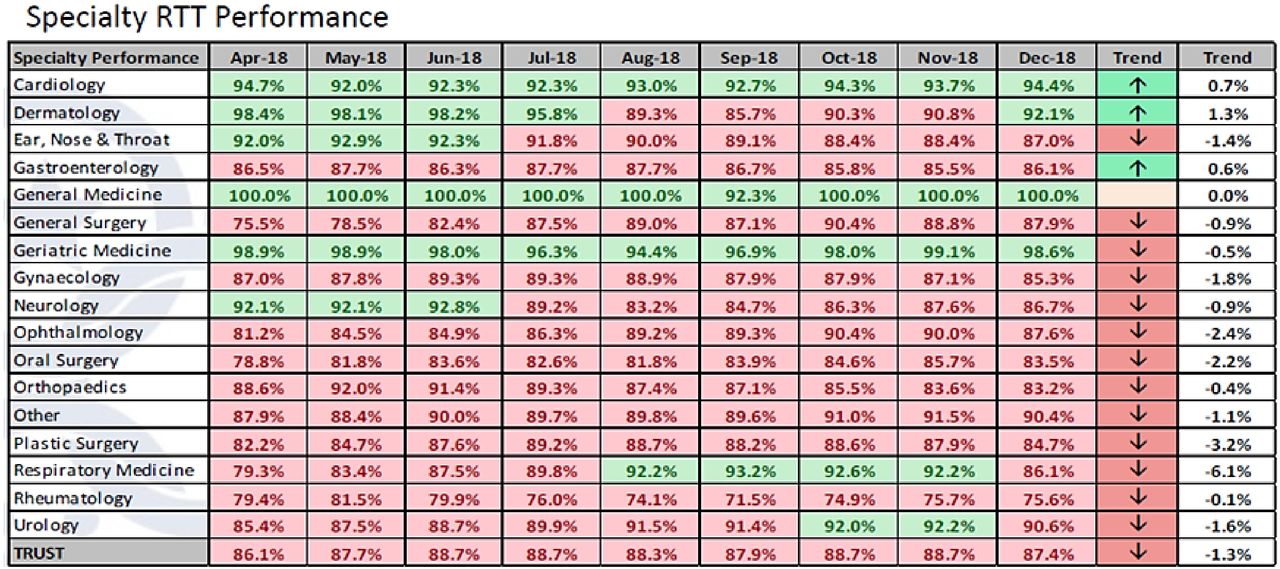
Data from an acute trust showing referral to treatment (RTT) performance against nationally mandated targets. Red and green indicate whether a target is being achieved.
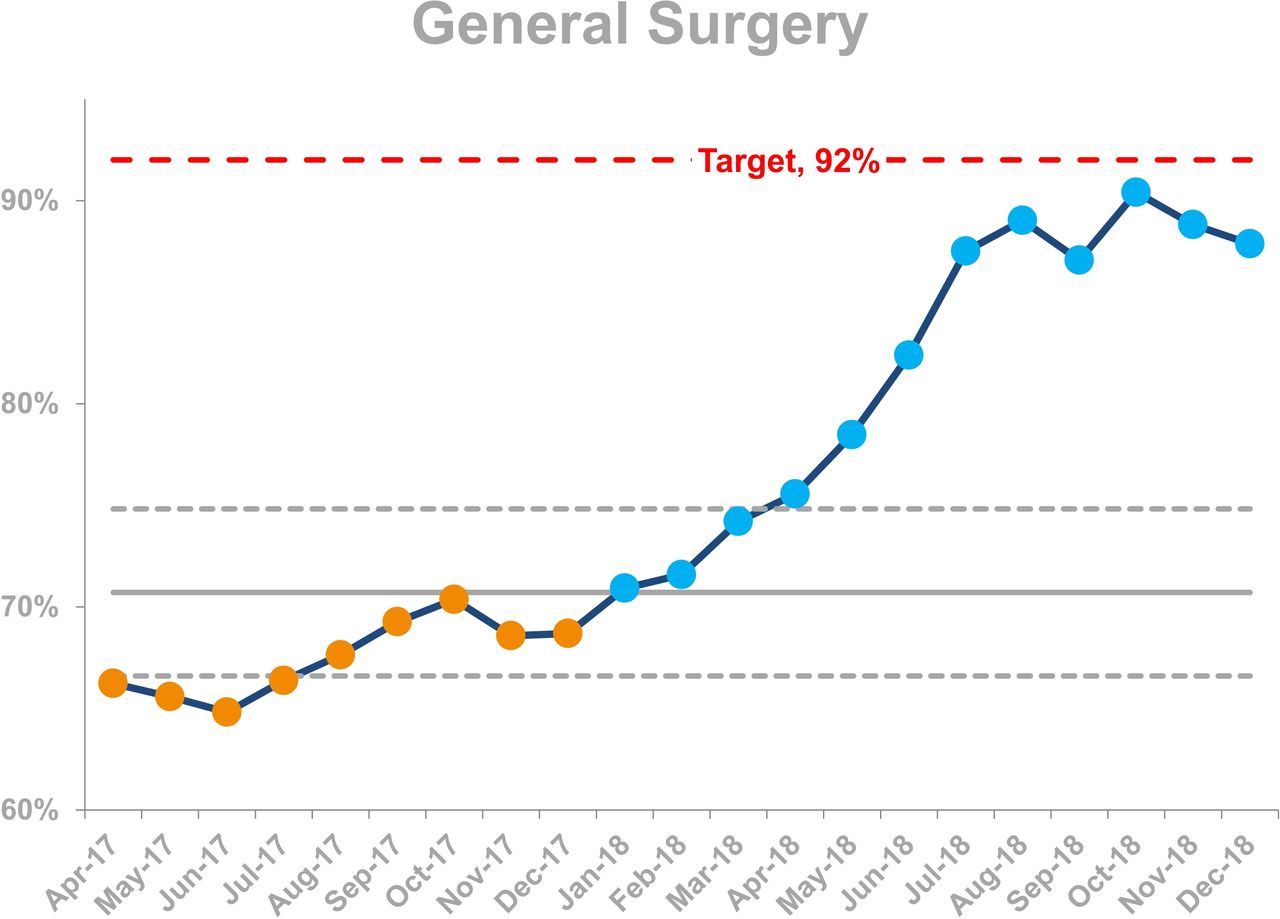
General surgery data from figure 1 presented in SPC format. This reveals improvement that has been masked by the red.

Rheumatology data from Figure 1 presented in SPC format. This reveals a deteriorating pattern of performance which was difficult to detect in Figure 1.
This example illustrates how RAG reports provide a picture of performance, which can be difficult to correctly interpret. In figure 1, general surgery and rheumatology appear to be performing in a consistent way—both are red with a downward trend arrow. By contrast, the SPC charts in figures 2 and 3 are visually impactful and reveal a very different picture of performance with general surgery showing a significant improvement over time and rheumatology significantly deteriorating.
Schmidtke et al 8 found limited use of SPC in the NHS trust board papers they sampled and proposed a number of potential reasons for this including board members lacking awareness of SPC (and therefore not requesting SPC charts) and also lacking confidence in correctly interpreting the charts. The Making Data Count Programme sought to address these issues. With the development of tools, resources and training, the programme aimed to increase knowledge of SPC among senior leaders, to speed up the adoption of evidence into practice and to give boards the collective confidence to convert from routinely using RAG ratings in board reports to using SPC charts.
The educational intervention
In September 2017, NHS Improvement developed a training module for boards on how to make better use of data by introducing them to the following:
The limitations of RAG reports and two-point comparisons.
Different types of variation and advice on how to react to each.
Helpful approaches to decision-making.
The underpinning science and evidence base in healthcare for the use of SPC.
The board training module was tested with pilot sites between November 2017 and January 2018 as part of a wider ‘Leading for Improvement’ workstream in DPIC, which also helped boards to understand quality improvement (QI), the role of culture and governing for improvement.
Each session was evaluated, and board members were asked to provide feedback on the balance of discussion and presentation and to rate the quality and usefulness of the training on a scale out of 1 (strongly disagree) to 5 (strongly agree). Free text comments were requested to understand what went well, what could have been done differently and what key messages participants took from the training. Analysis of this feedback provided important learning and resulted in the refinement of presentation materials and process of delivery.
Key learning points were as follows:
While most trusts used SPC to some degree for quality improvement projects, it was not seen as a mainstream approach for analysis at board level. The term ‘measurement for improvement’ (frequently associated with SPC) placed SPC in a box reserved for QI projects, and SPC was not considered a performance or assurance tool for the board. The emphasis of the training changed as a result to focus on SPC as a tool to understand process capability in relation to targets rather than improvement.
Style of delivery was important to the success of sessions. Board members enjoyed the interactive informal nature of the training and the use of memorable metaphors to reinforce teaching points, which avoided the requirement to focus on the technicalities of SPC.
One of the most impactful elements of the training reported by board members was the representation of a trusts’ own data in SPC format to unearth the previously hidden ‘stories’. Further emphasis on local data was incorporated into the training as a result of this learning;
Raising awareness of the significant evidence base that confirmed the benefits of using SPC to inform good decision-making gave board members additional confidence to convert to SPC.
Light touch support was offered to trusts following their training to help embed the new techniques in local business as usual reporting systems. A benefit of this was to dispel the commonly held misconception that costly software was required to adopt SPC.
Evaluation was undertaken by analysing the quantitative analysis of the increase in SPC use across the 61 participating boards and by calculating satisfaction scores from training evaluation forms. Qualitative reflections of training participants were captured in free text in the training evaluation forms and thematically analysed, and seven senior leaders from four boards consented to participate in qualitative post-training interviews with an independent evaluator to undertake a formative realist evaluation.
Results
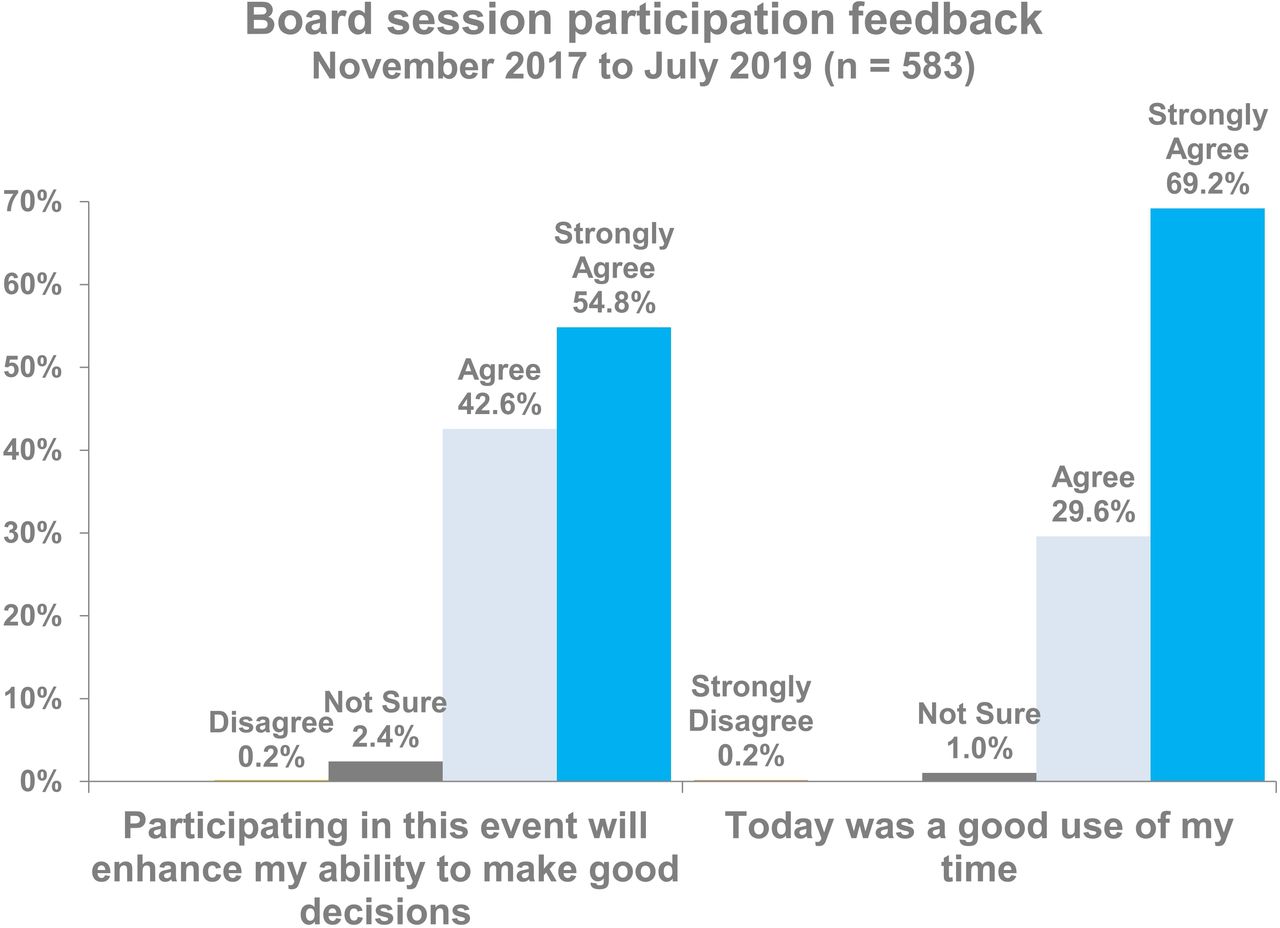
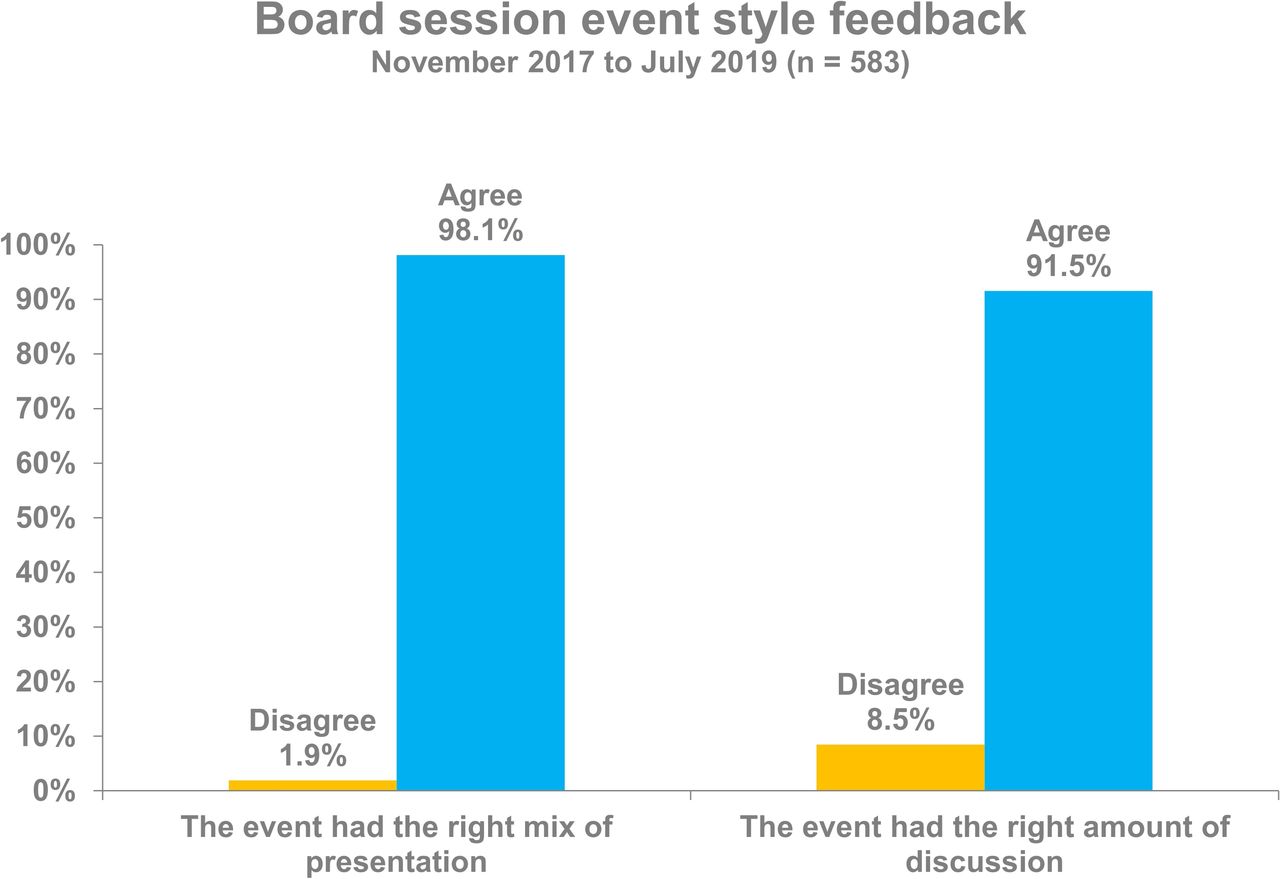
Between November 2017 and July 2019, 61 NHS trusts received the Making Data Count board training, and 583 participants provided feedback. The majority of feedback came from executive and the non-executive members of the board. On occasion, a senior representative from a relevant department, such as the head of business intelligence, also joined the session and provided feedback. Ninety-seven percent of respondents agreed that participating in the event would enhance their ability to make good decisions with 55% from this group agreeing strongly. Ninety-nine percent of respondents agreed that the 90-minute session was a good use of their time, with 69% from this group agreeing strongly. These results are provided in figure 4. Figure 5 demonstrates the high proportion of respondents who reported that the session had the right mix of presentation (98% agreed) and discussion (92% agreed).

A summary of feedback from participants describing their views on the impact of Making Data Count board session.

A summary of feedback from participants.
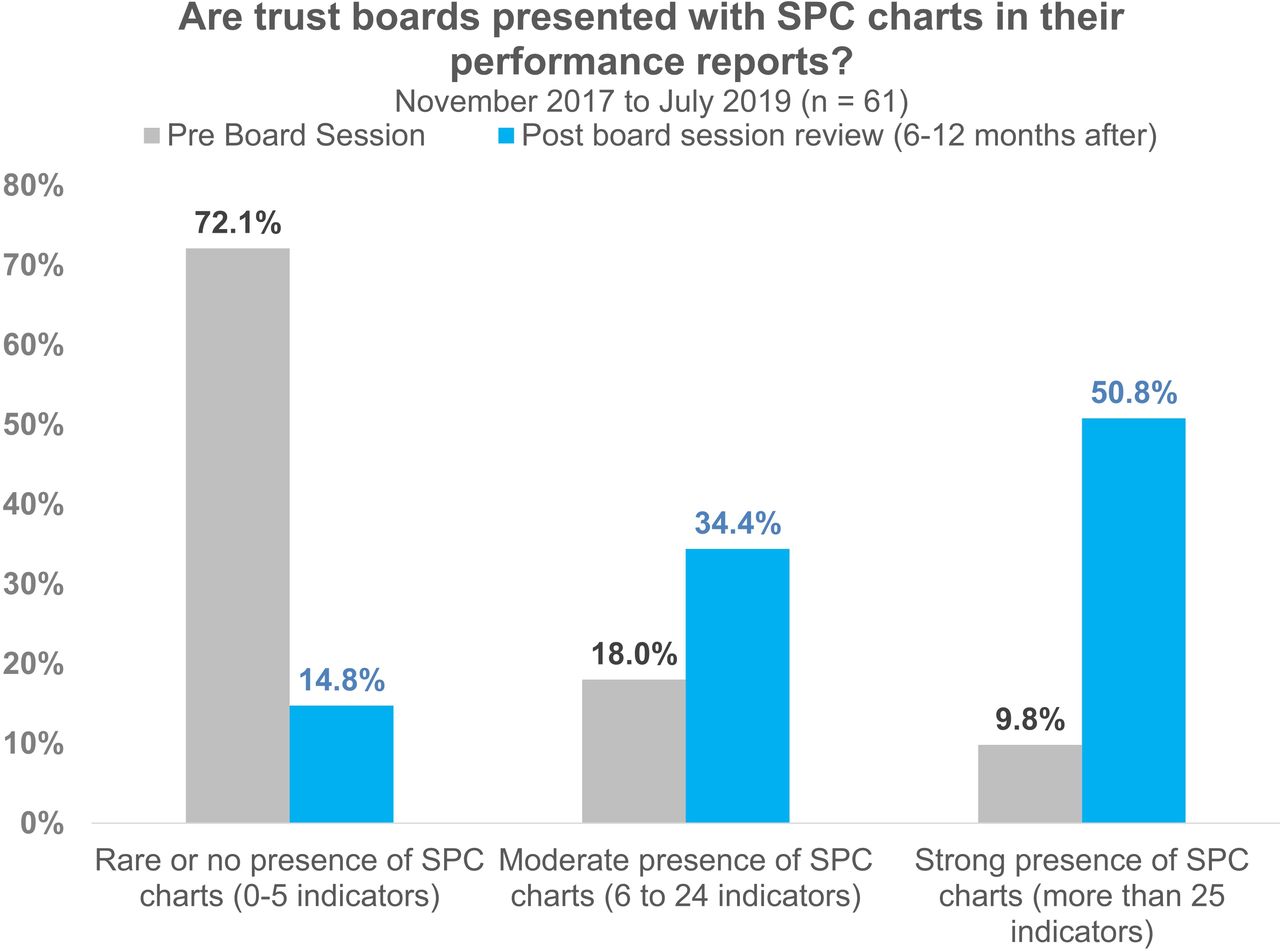
A review of the presence of SPC charts in the board papers of the 61 trusts prior to the Making Data Count training reveals that 72% contained between zero and five SPC charts, 18% contained 6–24 SPC charts and only 10% contained more than 25 SPC charts. Looking at the same trust board papers 6–12 months after the training, there has been a significant increase in the presence of SPC charts in board papers with 34% of papers containing 6–24 SPC charts and 51% of papers containing more than 25 SPC charts. This change is demonstrated in figure 6.

A comparison of the presence of statistical process control (SPC) charts in board papers before and after a Making Data Count training session.
To assess whether the training leads to any behavioural changes in individuals or boards, an independent evaluator interviewed representatives of four of the initial eight trusts by phone several months after their session, to find out what impact the training had made and if any behavioural changes had occurred. While the sample size was small (seven interviews in total: with chairs, chief executives, trust secretaries and non-executive directors), clear themes emerged.
Interviewees described that the training had been impactful because it was accessible to all, regardless of prior knowledge of SPC, and had been an enjoyable collective learning experience. All felt that the training had rapidly helped to change the way the board thought and acted in relation to measurement for improvement.
By exposing the full board to SPC as a way to look at measures, the training helped us all learn together and have the same level of knowledge. We all gained new insights, and it has helped us to think about where and how to begin experimenting with presenting metrics in SPC format.
I thought it was terrific. In fact, I wrote a note to the chairperson to share my observation that it was the best board session I had attended in 4 years. The reason was that the training was accessible, not too basic but not too advanced; it was not too short or too long in length; and it was directly relevant and applicable to the organisation as a whole and also useful for my role.
All participating boards acknowledged variation of awareness and skill in SPC within the team. Some board members had considerable expertise and experience of SPC from health or other industries, and there were others for whom this was a totally new concept, skill set and language to learn. For this reason, many of the respondents commented on how important it was to learn collectively in a safe and informal way and to develop a shared understanding and language about SPC. Interviewees described how this group process supported the collective energy for change and commitment to act.
All agreed that the most powerful element of the training was for the board to see their own data in RAG ratings and then to compare the same data in SPC.
The most powerful intervention was to use our own data and play it back to us. It helped us to see what’s missing.
People described how ‘shocked’ they felt when they saw their own trust’s data in SPC form compared with typical RAG ratings. For many, the most disconcerting element was realising that metrics that they had perceived as ‘safe’ because the data were shaded amber or green were in fact in need of improvement or, equally, feeling shocked that a green RAG rating was giving false assurance when standards were slipping. Many could see that they had wasted considerable time and effort in the past worrying about red RAG ratings where the SPC equivalent demonstrated natural variation rather than a decline in standards. People described this moment of emotion and shock in the training as the ‘teachable moment’ that provided the catalyst for change.
Interviewees described how the training had an immediate and lasting impact on their behaviour both as individuals and as a board.
On a personal level, it was a shock to the system; it showed me that things need to change. The impact of seeing your own trust’s data being played back to you is very powerful. It highlighted good and bad stories that we were completely unaware of. It showed how unclear the current system is.
I could see how clear the SPC charts were compared with the current offer from informatics. I learnt how helpful it is to see changes labelled on the charts, helping to provide a narrative for unexpected events.
It was incredibly powerful to have our own data fed back to us, really powerful. If it had been other people’s data, we would have thought it was interesting, but maybe not relevant, or we could have thought it’s not made here, and so, we could have critiqued it. What was so powerful was seeing the data we had already accepted played back to us in a new way, the same data but telling a completely different story. It was this impact that made the difference.
By the end of the session, all four boards had agreed to move to SPC; however, the speed and process of adoption varied. Some included data analysts in the training to make changes immediately, whereas other interviewees reported that adoption was slower due to bottlenecks in availability, capacity and capability of good data analysts. One board cancelled the next month’s standard report in order to create time to design a new SPC board report format.
All behavioural and organisational change was achieved within current resources and without the purchase of additional software.
We are already seeing changes. We have completely overhauled the board report. The contrast from July is that by September, we can see SPC in every individual section. It’s made it easier to go through the board paper, and it’s now significantly clearer about what we should focus on.
We also chose to bring in the performance team. We wanted to get a collective understanding of what was needed. So, it was not an isolationist session; it was leaders and people who knew about the data. We wanted everyone to leave the session knowing what we were aiming for, what to do and how.
There have been no additional costs. All the changes have been possible within current resources. This is about doing things in a different way. We were lucky that we had staff with good analytical skills and they have been able to do this work quickly and effectively.
An unintended consequence of the Making Data Count training was that many boards identified a need to undergo further board development training in QI methodologies and the role of the board in supporting an ‘improvement culture’. Six of the seven board members interviewed confirmed that individual members and/or whole boards had committed to undertake further QI training and had plans to achieve this within the next 12 months.
We have made a commitment as senior leaders to undergo QI training, doing bronze, silver and gold levels.
Six of the seven board members also said that the training had helped them to make behavioural changes and to lead in a new way, with more agility and strategic precision. They also described how SPC had helped them gain a greater confidence in both the quality and reliability of the data, decreasing the board‘s tendency to micromanage when anxious about red RAG ratings.
It’s given us a focus for our energy and a clarity to our questions. We have been able to challenge ourselves and ask ‘Is it more data we need or more action?’. For instance, violence and aggression in divisions have risen. We don't need more data to check this; what we need is to ask each division about why and what they are doing to change this and what help and support they need. In the past, I think the board used to get caught up in ‘going too far down’, asking for more and more data and not always seeing the wider picture. This approach allows the board to have greater foresight and agility.
I learnt how SPC can support better governance processes and how it supports the better hygiene of data and increases the level of comfort and assurance for boards. It gives them more assurance than before because the data are more credible. This allows the board more time to devote to strategic leadership, rather than having to challenge or worry about the data. This allows us to spend more time thinking at a system level rather than asking for more clarifying data. In the past, we might see data that was rated ‘red’, and then, we would request more data, and this process could take 3 months to come back to the board as new work had to be undertaken by managers in the directorate. Things could get ‘bogged down’ in this process, and often, the additional data requested did not shed any new light on the issue. Now, with SPC, the board has a better sense of where to focus; it helps us to ask strategic rather than operational questions.
The (board report) quality is better; it’s easier to understand; the data are a week closer to real time.
There has almost been a strengthening in the trust’s executives’ ability to challenge something and then take the correct actions.
All interviewees felt that the training had already made a difference to the way that the trust approached the data, the way the board led improvement and the types of assurance questions that the board asked. The majority felt that the training would lead to long-term cultural changes in the trust, because it had created a paradigm shift in how data were perceived and they felt clear that its impact would not just be limited to changes to board reporting processes but would also filter down throughout the organisation.
There are organisational barriers, but we are working to correct these. I think we have to be ruthless to prioritise this agenda over some of the others. The benefits are enormous, as it makes you realise what you are really measuring. It’s not just ticking a box; it’s a fundamental and wide-ranging change that has to go right through the organisation, with everyone seeing the data and understanding its importance.
Discussion
The main finding of this study is that the qualitative and quantitative evidence confirms that the Making Data Count board intervention has had a significant impact on influencing the format of performance reports reviewed by boards and also the behaviours of board members. For the trusts included in this study, prior to the board intervention, 72% of board papers contained between zero and five SPC charts. Six to twelve months after the intervention, a significant increase in the presence of SPC charts can be observed with 51% of trust board reports containing more than 25 SPC charts.
The qualitative data show that it was the informal and engaging delivery style of the educational intervention plus the use of the trust’s own data that created a powerful collective ‘teachable’ moment for boards. This led to board members enthusiastically discussing the session with peers in other trusts, which resulted in many more trusts requesting the training, creating a ‘pull’ rather than a ‘push’ adoption effect.
While the sample size of trusts included in this study is small and the data presented in this article is limited in scope and form to a QI evaluation, we were able to undertake an objective measure of change in the presence and use of SPC charts by the boards that took part in the education intervention. An independent evaluator thematically analysed post-training qualitative data; however, the sample size of organisations (n=4) and board members (n=7) interviewed was small and vulnerable to bias. The methodology of study would have been improved had we been able to increase the sample size and also undertake direct observations of behavioural change in the culture of the board, seeing how the use of SPC might have influenced discussions and decision-making practices in action post educational intervention. We can however see that there has been an objective increase in both the number of SPC charts present in board reports and the quality of the accompanying descriptive narratives Together, these changes demonstrate an increased understanding of core SPC concepts such as warranted and unwarranted variation and correct highlighting of when board discussion is advised.
Our findings suggest that further research into the impact of the Making Data Count training for boards might be useful in order to observe the longer-term impact of the intervention and to reveal more about the knowledge, skills and attributes that senior NHS leaders require to help embed a culture of continual improvement into NHS organisations through the better use of measurement for improvement.
Our results appear to concur with Schmidtke et al 8 and with a systematic review of the use of SPC in healthcare by Thor et al 9 who found that common barriers to widespread use included lack of knowledge of SPC and how to apply it in healthcare and that training users in the application of SPC may be helpful. Making Data Count appears to have helped board members with no experience of SPC to gain new insight and also helped the board as a whole reframe how they think about measurement for improvement. McKenzie10 argues that SPC represents a challenging new way of thinking about data, and our study found that Making Data Count cocreated a powerful ‘teachable moment’ where board members saw the trust’s own data in both RAG and SPC form side by side. This was experienced by participants as a paradigm shift in both knowledge mobilisation and leadership behaviours.
Forbes and Milliken11 also argue that busy board members sometimes fail to adequately analyse documents prior to board meetings and so increase the probability of passivity in meetings and decrease the effectiveness of corporate governance. Our findings suggest that by using SPC, board members found it easier to analyse documents both prior to and during board discussion as the data was more ‘user friendly’ and that they wasted less time questioning misleading RAG ratings in the meetings, making for better-quality discussions and stronger board performance.
Conclusion
In conclusion, the Making Data Count education intervention has increased the use of SPC in board reports and has had some self-reported impact on individual and collective behavioural changes by board members, including reducing the amount of time wasted by boards discussing insignificant changes in data and providing a clearer focus on those issues requiring board attention. Further research is required to see if this immediate impact is sustained over time and to identify the key enablers and barriers to organisational adoption of SPC by boards in the NHS.
Data availability statement
All data relevant to the study are included in the article or uploaded as supplementary information. All data relevant to the study are included in the article.
Ethics statements
Patient consent for publication
Footnotes
Twitter @samriley
Contributors SR designed, led and iterated the original work, TN supported quantitative data collection and analysis and contributed to design and delivery of the materials and AB designed and undertook qualitative interviews and analysis. All contributed to the authorship of the paper.
Funding The authors have not declared a specific grant for this research from any funding agency in the public, commercial or not-for-profit sectors.
Competing interests None declared.
Provenance and peer review Not commissioned; externally peer-reviewed.